
Empirical method for modeling the percent depth dose curves of electron beam in radiation therapy
Empirical method for modeling the percent depth dose curves of electron beam in radiation therapy
Polish Journal of Medical Physics and Engineering
The Journal of Polish Society of Medical Physics
Dong-Ji CHENa, Yan-Shan ZHANGa, Yan-Cheng YEa, Jia-Ming WUa,b,c,*
aDepartment of Heavy Ion Center of Wuwei Cancer Hospital, 1.Gansu Wuwei Academy of Medical Sciences; Gansu Wuwei Tumor Hospital, Wuwei City, Gansu Province, 733000, China
bDepartment of Medical Physics, Chengde Medical University, Chengde City, Hebei Province, China
cDepartment of Radiation Oncology, Yee Zen General Hospital, Tao Yuan City, Taiwan
*jiaming.wu@chmsc.com
Abstract
Introduction: This study presents an empirical method to model the electron beam percent depth dose curve (PDD) using the primary and tail functions in radiation therapy. The modeling parameters N and n can be used to derive the depth relative stopping power of the electron energy in radiation therapy.
Methods and Materials: The electrons PDD curves were modeled with the primary-tail function in this study. The primary function included exponential function and main parameters of N, µ while the tail function was composed by a sigmoid function with the main parameter of n. The PDD for five electron energies were modeled by the primary and tail function by adjusting the parameters of N, µ and n. The R50 and Rp can be derived from the modeled straight line of 80% to 20% region of PDD. The same electron energy with different cone sizes was also modeled with the primary-tail function. The stopping power for different electron energies at different depths can also be derived from the parameters of N, µ and n. Percent ionization depth curve can then be derived from the percent depth dose by dividing its depth relevant stopping power for comparing with the original water phantom measurement.
Results: The main parameters N, n increase, but µ decreases in primary-tail function when electron energy increased. The relationship of parameters n, N and LN(-µ) with electron energy are n = 31.667 E0 - 88, N = 0.9975 E0 - 2.8535, LN(-µ) = -0.1355 E0 - 6.0986, respectively. Stopping power of different electron energy can be derived from n and N with the equation: stopping power = (−0.042 ln(NE0)+1.072)e(-nE0•5•10-5+0.0381)•d,where d is the depth in water. Percent depth dose was derived from the percent reading curve by multiplying the stopping power relevant to the depth in water at certain electron energy.
Conclusion: The PDD of electrons at different energies and field sizes can be modeled with an empirical model to deal with the stopping power calculation. The primary-tail equation provides a uncomplicated solution than a pencil beam or other numerical algorism for investigators to research the behavior of electron beam in radiation therapy.
Key words: percent depth dose modelling; electron; primary-tail equation
Introduction
Linear accelerator electron beam irradiation offers efficient advantages in terms of dose uniformity in the treatment of the target volume of skin and lip cancers, chest wall irradiation for breast cancer, administering boost dose to nodes, head and neck cancers and minimizing dose to deeper tissues.
Although electron beams played an important role in superficial lesions such as H&N cancers, et al in the earlier decades before dynamic techniques (VMAT), which are now golden standard. It is no doubt that the Volumetric Modulated Arc Therapy treatment technique allows the maximum photon dosage and better conformity to the target while sparing the surrounding normal healthy tissue and minimizing the radiation-damage dose as low as possible. The shape of the depth dose curve character is somehow the major attraction of the electron beam offers a distinct clinical advantage over the conventional x-ray modalities for the superficial lesion.
The depth dose curves, beam profiles, absolute output and cone factor with different electron energy and cone sizes must be measured and implemented to treatment planning system prior to electron beam can apply for clinical use. The electron dose distribution calculation algorithms mainly use the Monte Carlo dose engine and pencil beams model1,2 or other numerical model3,4 in commercial treatment planning system5. The parameters of model in pencil beams or Monte Carlo treatment planning system for electron beams often need iterative adjustments to fit the measured depth dose and profiles isodose-distribution in order to perform accuracy dosimetry calculation and prediction of PDD.
The pencil beams or Monte Carlo simulation algorism describe PDD by using a complex Gaussian pencil beam theory with error function and σr(z), the root mean square radial spread to calculate dose at any depth of z.6
In this study, we proposed a simple mathematic equation to model the PDD by using the primary-tail function. Besides the useful empirical modeling of PDD, we also used this empirical model to convert the depth ionization curves measured with an ion chamber to depth dose curves by making the correction for restricted mass stopping power ratio of water to air,  , as a function of mean electron energy at depth.7
Materials and Methods
Experiment Design and Steps
The experiment was conducted in the following steps:
- Measurement of electron beam ionization depth dose curves of five energies, 6 MeV, 9 MeV, 12 MeV, 15 MeV, 18 MeV, at SSD = 100 cm with different cone sizes and different electron cutout by parallel plate chamber in 3-dimensional water phantom.
- Measurement of electron beam percent depth dose curves of five energies at SSD = 100 cm with different cone sizes and different electron cutout by Gafchromic film in solid water phantom.
- Empirical modeling of the percent depth dose curves of electron beams.
- Logistic regression of the empirical modeling parameters of N, µ and n.
- Prediction of restricted mass stopping power ratio of water to air, , as a function of mean electron energy at depth via the parameters N and n.
The details of each step are described in the following sections.
Ionization depth curve measurement
In this study, the measurements of percent ionization depth curve were carried out at WuWei Heavy Ion Center, Wuwei Cancer Hospital, GanSu, China (WHICH) for Varian Vital Beam linear accelerator, five electron energies from 6 MeV to 18 MeV, with an increasing interval of 3 MeV, at SSD = 100 cm, with cone sizes 6 cm × 6 cm, 10 cm × 10 cm, 14 cm × 14 cm, 20 cm × 20 cm and 25 cm × 25 cm. Since the plane-parallel chamber has a small plate separation and the charged electron particle fluence is mostly forward-directed, it is explicit that the point of measurement is the front surface of the cavity. PTW MP3-T water phantom (PTW ionization Feiburg Gmbh) was used for the percent ionization depth curves measurements. The depth curve measured by plane-parallel chamber was then converted to percent depth dose with the conversion function provided by water phantom, and this percent depth dose was then compared with the percent depth dose curve measured by film.
The comparison of depth dose curve converted via the ionization curve measured by Marcus parallel-plate chamber with Gafchromic EBT3 film
We used Gafchromic EBT3 films (Ashland Specialty Ingredients GP, NJ USA; Lot # 04022001, Exp. Date: April 2020) for the depth dose curves measurement for determining the percent depth dose. The film processing and dose profile measurements followed the international protocols.8 A pre-exposure technique was used for the calibration curve derivation.9 This was performed by giving each film a priming dose of 2 Gy to homogenize the film density using our WHICH facility with a dose of 1 Gy at the electron energy of 12 MeV. We then measured the dose homogeneity using a densitometer. Graded doses of 5, 10, 15, 40, 60, 80, 100, 150 and 200 cGy were given to the Gafchromic film to obtain the Hurter-Driffield calibration curve (H-D curve).
All exposed films of depth dose curve were then scanned with an Epson Expression 11000XL scanner in the 48-bit RGB mode (16 bits per color), and the data were saved as tagged image file format (TIFF) and analyzed by the VariSoft imaging procession software. A red filter was placed on top of the Gafchromic films before scanning to increase the slope of the H-D curve, thereby raising the resolution of the dose-OD curves.10
The depth dose curve derived from the ionization depth curve from the plane-parallel chamber was then compared with the depth dose curves measured by Gafchromic EBT3 films.
Absolute output and machine quality assurance were performed before conducting the measurements of percent ionization depth by plane-parallel chamber and percent depth dose curve by Gafchromic film.
Electron percent depth dose numerical equation
There are two numerical equations for describing the percent depth dose curves, Primary function and Tail function. Primary function is described as follows,
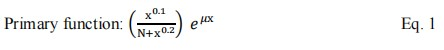
where x is the horizontal axis in a unit of mm, x also denotes the depth in water in a unit of mm, N is a beam hardening factor (scalar value), µ is the linear attenuation factor in a unit of mm-1. Only scalar portion of the parameters x, N and µ (without unit) are taking into calculation in primary function.
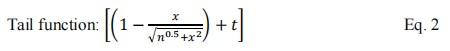
where x is the horizontal axis in unit of mm, x also denotes the depth in water in unit of mm, n is a spread factor (scalar value), namely, n can be treated as the expansion power of the penumbra area in Figure 2c. t is a factor of scalar for adjusting the height of tail.
The empirical function of percentage depth dose is the combination of these two functions, denoted as PDDprimary-tail, in abbreviation of PDDp-t:
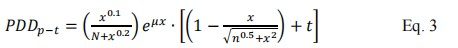
All percentage depth doses of five electron energies with different cone sizes at SSD = 100 cm were adjusted by the main parameters of N, n and µ to get the best fitting.
Results
The best fitting of percent depth dose by empirical function in five electron energies
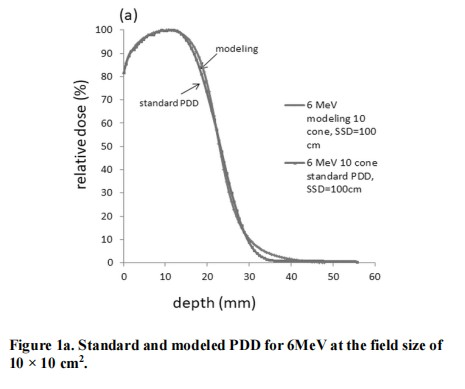
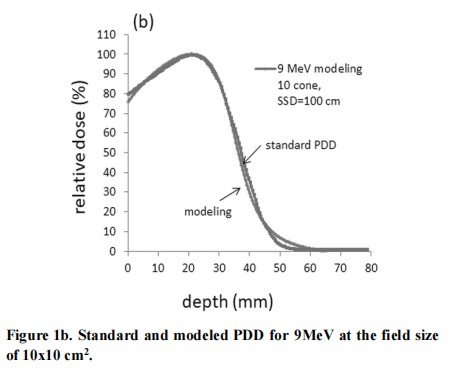
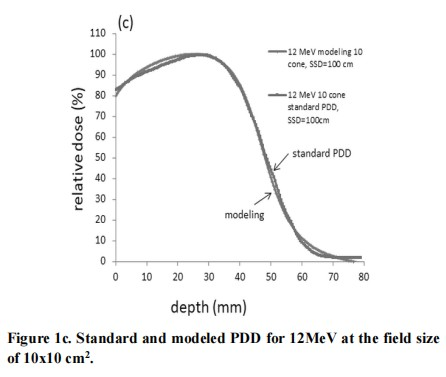
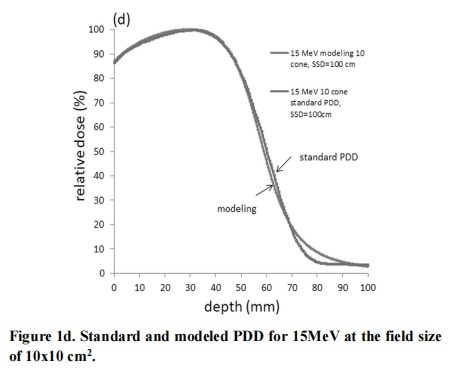
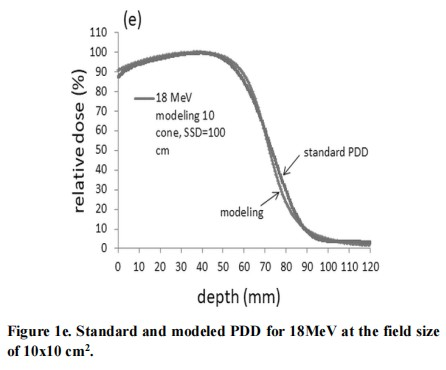
The percent depth dose of electron beam with different energies adopted in this study was already measured by the water phantom at the commission of linear accelerator. By adjusting the main parameters of N, n and µ we get the best fitting of all electron percent depth dose curves of every energy with different cone sizes in Figure 1.
Figure 1a to Figure 1e represents the fitting of the percent depth dose curve of electron energy from 6 to 18 MeV, respectively.
The percent depth dose fitted by empirical function in the same electron energy with different cone sizes
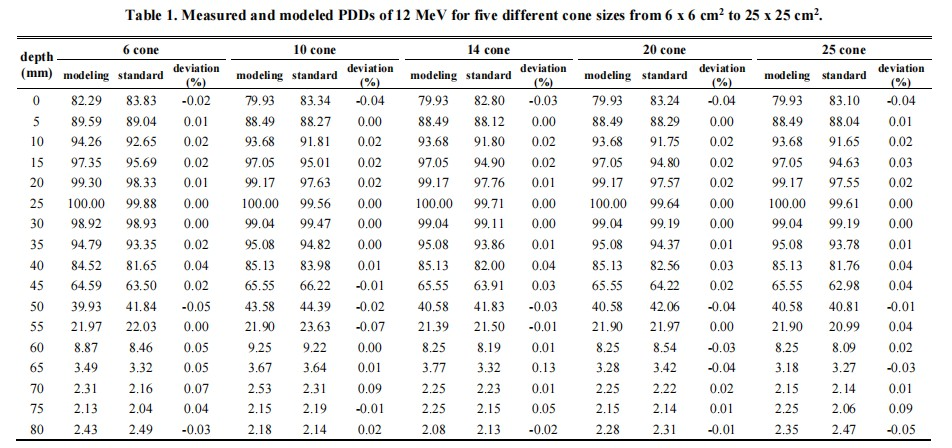
The percent depth dose varies tiny in the same electron energy with different cone sizes. Therefore, we tabulated the deviation of measured and modeled with one of the electron energy of 12 MeV.
Table 1 represents the fitting of 12 MeV electron beam PDD with 5 cone sizes from 6 cm × 6 cm to 25 cm × 25 cm.
The best fitting of percent depth dose by the main parameters of N, n and µ in empirical function for all electron energies with different cone sizes
Table 2 shows the main parameters of N, n and µ of the best fitting for percent depth dose curves at every energy with different cone sizes. According to Table 2, N, n increases while µ decreases when electron energy increases.
Discussion
The percent depth dose can be fitted quite well with the primary-tail modeling by adjusting the main parameters of N, n and µ in all five electron energy along the standard PDD curves except for the descending – X-ray contamination area in Figure 1.
It is obvious the modeled percent depth dose curve as well as the standard percent depth dose curves varied a little deviation with field size at the electron energy of 12 MeV in Table 1.
The parameter N represents beam harden factor of the primary function for describing the buildup region of the electron PDD.The deviation of entrance dose and the maximum dose (dmax) is smaller in high energy electron beam than in low energy electron beam, which means that a larger electron energy comes with a steeper dmax due to the penetrating ability of strong struggling power in the medium. Therefore, the more electron energy, the more N, n and µ it have for the PDD curve fitting as show in Table 2.
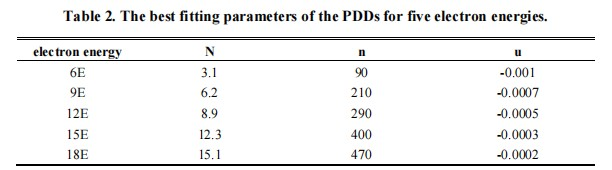
Figure 2 in a and b shows the best fitting of parameters N and n in the 9 MeV electron beam PDD. The parameter of N in primary function represents the beam harden factor, therefore, we can adjust the value of N to fit the measured PDD. Figure 2 demonstrates how the primary function is affected by parameters N and n. Since N is the harden factor, higher electron energy comes with a larger value of N, as shown in Table 2, and the curve become less attenuated for a large N as shown at the bottom in Figure 2c.
The factor n represents the spreading factor at any electron energy. Namely, n can be treated as the expansion power of the penumbra area. In Figure 2c, the penumbra is sharper and becomes gradually flattened for n from 90 to 470, respectively. A large scalar number of n represents the more expansion of the penumbra. On the contrary, the smaller n, the sharper of the penumbra of the electron PDD in Figure 2c. Explicitly, a larger electron beam energy comes with a larger n, as shown in Table 2 and Figure 2c.
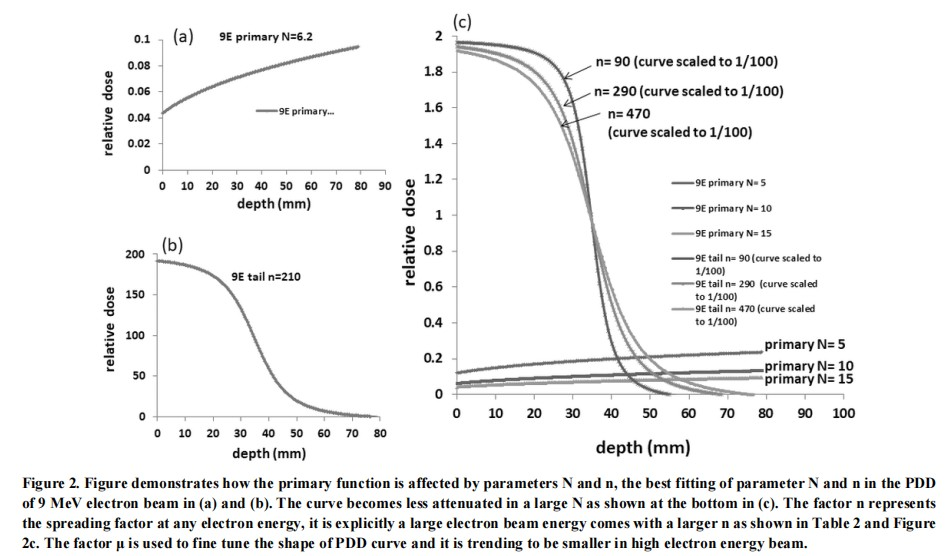
The factor µ is used to fine tune the shape of PDD curve, and it is trending to be smaller for high electron energy beam, as shown in Table 2.
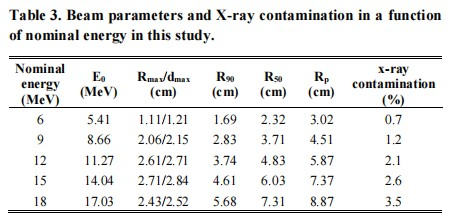
In this study we defined the practical range, Rp, as the depth of the point where the tangent to the descending linear portion of 80% to 20% of the curve intersects the extrapolated x-ray contamination at the point of inflection. The depth at which the dose is 50% of the maximum dose is defined as R50, and the mean energy of the electron beam, E0, is

Table 3 show the maximum reading depth, dose maximum depth and mean energy of the electron beam, E0. The depth at which the dose are 50%, 90% of the maximum dose is defined as R50, R90, respectively as the American Association of Physicists in Medicine (AAPM) protocol recommended in this study.
A good agreement of PDD measured by film and the PDD measured by water phantom converted by the parallel-plate ion chamber has been observed in this study. It is obvious that the energy independence of film may be explained by the fact that the ratio of collision stopping power in emulsion and in water varies slowly with electron energy.
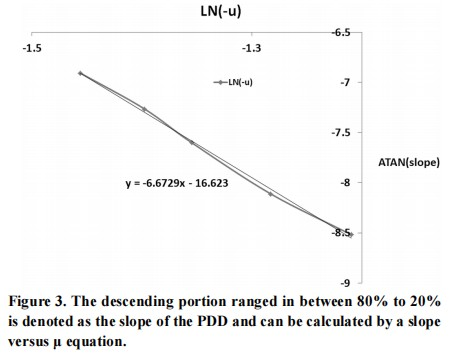
The descending portion, ranged between 80% to 20%, is denoted as the slope of the PDD. It can be calculated with the equation,

The relationship between µ and slope is shown in Figure 3, as the figure showed, the slope decrease when the µ increase, which means the larger electron energy, the less side scatter it is.
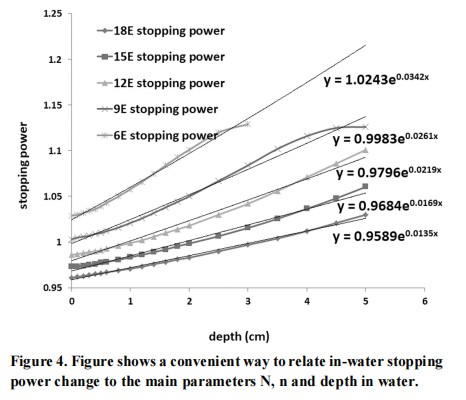
When an electron beam penetrates a medium (water), the change in electron energy spectrum is reflected by a change in the percent depth dose curve. It is convenient to relate in-water stopping power change to the main parameters N, n and depth in water in Figure 4. For electron, the incident of the monoenergetic spectrum is degraded as it penetrates the water.
The restricted stopping power  increases significantly with depth. In this study, the stopping power for a certain energy and depth can be derived by the N and n relative to its electron energy in this equation,
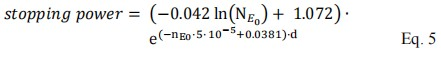
where d is the depth in water.
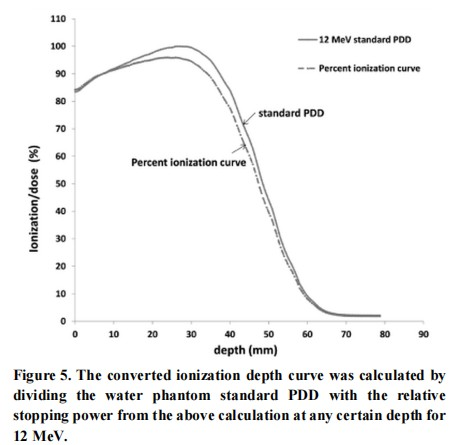
The converted ionization depth curve calculated by dividing the water phantom standard PDD with the relative stopping power from the above calculation at any certain depth for 12 MeV is shown in Figure 5.
Conclusions
We presented an empirical method in this study to model the electron beam percent depth dose curve (PDD) by using the primary function and tail function in radiation therapy. The primary-tail equation provides a uncomplicated solution than pencil beam or other numerical algorithms for investigators to do researches regarding the behavior of electron beam in radiation therapy.
Acknowledgement
The author appreciates Professor Zhang Yan Shan, and Professor Ye Yan Cheng for their great contribution to this study. Professor Zhang Yan Shan is juxtaposed with the first author (co-first authors with equal contribution).
Professor Ye Yan Cheng is juxtaposed with correspondence author (co-corresponding authors with equal contribution).
This work was supported by the Funding: Key R&D plan of Science and Technology Program of Gansu Province, China. (19YF3FH001).
References
1. Hogstrom KR, Mills MD, Almond PR. Electron beam dose calculations. Phys Med Biol. 1981;26:445-59. https://doi.org/10.1088/0031-9155/26/3/008
2. Hogstrom KR, Mills MD, Meyer JA, et al. Dosimetric evaluation of a pencil-beam algorithm for electrons employing a two-dimensional heterogeneity correction. Int J Radiat Oncol Biol Phys. 1984;10:561-9. https://doi.org/10.1016/0360-3016(84)90036-1
3. Cygler JE, Daskalov GM, Chan GH, et al. Evaluation of the first commercial Monte Carlo dose calculation engine for electron beam treatment planning. Med Phys 2004;31:142-53. https://doi.org/10.1118/1.1633105
4. Pemler P, Besserer J, Schneider U, et al. Evaluation of a commercial electron treatment planning system based on Monte Carlo techniques (eMC). Z Med Phys 2006;16:313-29. https://doi.org/10.1078/0939-3889-00330
5. Ding GX, Cygler JE, Yu CW, et al. A comparison of electron beam dose calculation accuracy between treatment planning systems using either a pencil beam or a monte carlo algorithm. Int J Rad Oncol Biol Phys. 2005;63:622-33. https://doi.org/10.1016/j.ijrobp.2005.06.016
6. Khan FM, Higgins PD. Field equivalence for clinical electron beams. Phys Med Biol. 2001,46:9-14. https://doi.org/10.1088/0031-9155/46/1/402
7. Khan FM, Higgins PD. Calculation of depth dose and dose per monitor unit for irregularly shaped electron fields: an addendum. Phys Med Biol. 1999;44:77-80. https://doi.org/10.1088/0031-9155/44/6/401
8. Dreindl R, Georg D, Stock M. Radiochromic film dosimetry: considerations on precision and accuracy for EBT2 and EBT3 type films. Med Phys. 2014;24(2):153-163. https://doi.org/10.1016/j.zemedi.2013.08.002
9. Kamomae T, Miyabe Y, Sawada A, et al. Simulation for improvement of system sensitivity of radiochromic film dosimetry with different band-pass filters and scanner light intensities. Radiol Phys Technol. 2011;4(2):140-147. https://doi.org/10.1007/s12194-011-0113-6
10. García-Garduño OA, Lárraga-Gutiérrez JM, Rodríguez-Villafuerte M, et al. Effect of correction methods of radiochromic EBT2 films on the accuracy of IMRT QA. Appl Radiat Isot. 2016;107:121-126. https://doi.org/10.1016/j.apradiso.2015.09.016