A measure tool for evaluating dose falloff outside the target volume in high precision radiotherapy
A measure tool for evaluating dose falloff outside the target volume in high precision radiotherapy
Yan-Shan Zhang a , Li Meng a , Yan-Cheng Ye a,**, Jia-Ming Wu a,b,c,*
a Heavy Ion Center of Wuwei Cancer Hospital, Gansu Wuwei Academy of Medical Sciences, Gansu Wuwei Tumor Hospital, Wuwei City, Gansu province, China
b Department of Medical Physics, Chengde Medical University, Chengde City, Hebei Province, China
c Department of Radiation Oncology, Yee Zen General Hospital, Tao Yuan City, Taiwan
ABSTRACT
Introduction: A reliable and high resolution systemic with all aspects plan evaluation indices has been proposed in this study to measure the dose falloff outside the target volume. The essential goal of this study is to compensate the shortcomings for the judgment of planning target volume and dose-volume histogram by visual verification slice by slice in high precision modern radiotherapy techniques like stereotactic radiation surgery, volumetric arc therapy, and stereotactic body radiation therapy.
Materials and methods: Dynamic Gradient Index has been proposed both geometric and dosimetric orientated in all aspects plan evaluation indices to measure the dose falloff outside the target volume. Organ at Risk Integral Dose, and Target Specific Gain Ratio are created for evaluating highly conformal plans and provide better sparing of normal tissue. Users can do the plan evaluation indices calculation proposed in this study just simply with a sequence of exported data including normal tissue volume covered by every isodose line, target volume covered by every isodose line, and organ at risk volume covered by every isodose line from the approved planning system. The results here were also compared with several indices usually used such as gradient index developed by various authors.
Results: DGI avoids the mistaken judgment counted on a single gradient index on one referenced isodose line recommended by other published results for the evaluation of SRS, SBRT high precision needed plan. Dynamic Gradient Index is a measure of steep dose gradient outside the target volume; therefore; this index plays a significant role in SRS as a measure of plan quality, especially a judgment of complication cases. Furthermore, taking into consideration the Organ at Risk Integral Dose and normal tissue integral dose to evaluate the target therapeutic gain lets Target Specific Gain Ratio becomes a comprehensive evaluation tool for pros and constangled cases.
Conclusions: The function of DGI successfully reflects the advantage of fast expanded isodose lines (low dose gradient) could be easily examined. The plan superiority is determined by how close the DGI and the other indices are to the line of the benchmark. The growing speed of DGI for the SRS curve is slower similar to VMAT than the other two treatment techniques. The DGI of SRS beyond 100% inside the target area shows the advantage of the plateau between 100% and 110%, which means the change of dose gradient is smaller and this phenomenon could not be checked in DVH as well in other plan evaluation indices.
1. Introduction
The techniques of stereotactic radiosurgery (SRS) (Alongi et al., 2014; Nakamura et al., 2001; Sarah et al., 2019), stereotactic radiotherapy (SRT) (Menon et al., 2018), and stereotactic body radiation therapy (SBRT) (Ball et al., 2019; Joe et al., 2021; Mahmood et al., 2013; Videtic et al., 2018) became common practice in most clinics which refers to an emerging radiotherapy treatment planning procedure,therefore, for these modern radiotherapy techniques requires high reliability and accuracy plan evaluation tools (Baltas et al., 1998; Lomax & Scheib, 2003; Miften et al., 2004; Riet et al., 1997a). The objective of stereotactic radiosurgery is to deliver a therapeutic dose of 10–50 Gy to small targets in a single fraction. While conducting treatment planning for a radiosurgical dose to the target lesion, it is necessary to minimize the risk of radiation damage by reducing the dose to the surrounding normal tissue. To achieve good planning for a precise dose delivery without excessive risk of late radiation damage, several authors recommended gradient index, R50%, HDloc, and D2cm indices for evaluating dose falloff outside the target volume in high precision treatment techniques (Menhel et al., 2006; Shaw et al., 1993; Zentralbibliothek, 2018).
Recently the author proposed a simple formula of gradient index (GI) to complement the conformity index (Paddick, 2000; Paddick and Lippitz, 2006). GI was used to compare treatment plans of equal conformity. GI could become an effective tool to compare different methods of radiosurgery but GI provides only for single-point evaluation.
A study formed the basis for considering dose gradient outside the target volume was postulated as Equivalent Fall Off Distance (EFOD) to compare stereotactic radiosurgery plans (Leung et al., 1999). A research team proposed the term gradient index to coin that can measure the dosefalloff outside the target volume (Clinic, 1983). It is called Conformity Gradient Index (CGI) containing two components to deal with both conformity and gradient simultaneously. An effective radius of the target was conducted as the conformity gradient index which can be easily calculated by the treatment planning system. Another research postulated conformity index which was a part of CGI that could produce false perfect scores in evaluating the results of a treatment planning (Riet et al., 1997b). Another study proposed a simple formula of gradient index to complement the conformity index.21Gradient index defined with mathematical methods could become an effective tool to compare different techniques of radiosurgery, including intracranial SRT, static-beam IMRT, Tomotherapy, and Cyber- Knife (Ayo et al., 2010).
Although so many evaluation tools have been proposed for plan evaluation, DVH and visualizable 2D isodose distributions are the way currently used for various planning evaluation tools. The application of DVH is not sufficient in evaluating the pros and cons of tangled cases for high precision treatment planning. It is dangerous for the high precision plan that solely counts on the dose distribution of the target lesion without knowing detailed dose distribution in the whole irradiation area. The planner usually wants to know where the high dose area or abnormal dose distribution occurs when assessing rival plans with DVH, but currently, evaluation tools provide insufficient or just minor information. Now that the treatment plans cannot provide sufficient evaluation information for decision making, developing a powerful plan evaluation tool is of great urgency.
A reliable and high resolution systemic with in all aspects plan evaluation indices have been proposed in this study to compensate the shortcomings slice by slice visual verification for the PTV and DVH, and other indices for judgment in high precision required modern radiotherapy techniques like SRS, VMAT, and SBRT.
2. Materials and methods
The delivery of a uniform prescription dose to the target volume is the main goal of conventional radiotherapy while for SRS, SBRT is based on at least two paradigms of prescribing dose conditions. Firstly, is that for a limited volume of tissue, containing the gross tumor and its close vicinity, is targeted for treatment with a very high dose per fraction. Second, the volume of normal tissue receiving high doses while outside the target should be sharp to minimize the risk of treatment toxicity. Thus, many researchers (Helal & Omar, 2015; Pathak & Vashisht, 2019) raised the gradient index was proposed for describing the dose fall-off outside the target. Some researcher (Kataria et al., 2018) introduced a homogeneity index to prove the utilization of differential DVH information can result in the same even if the first plan is better than the other in terms of homogeneity.
Although many authors postulated a lot of plan evaluation tools, it seems still to lack a systemic consideration solution. A reliable and high resolution systemic with in all aspects plan evaluation indices have been proposed in this study to compensate the shortcomings of the indices for judgment in high precision required modern radiotherapy techniques like SRS, VMAT, and SBRT.
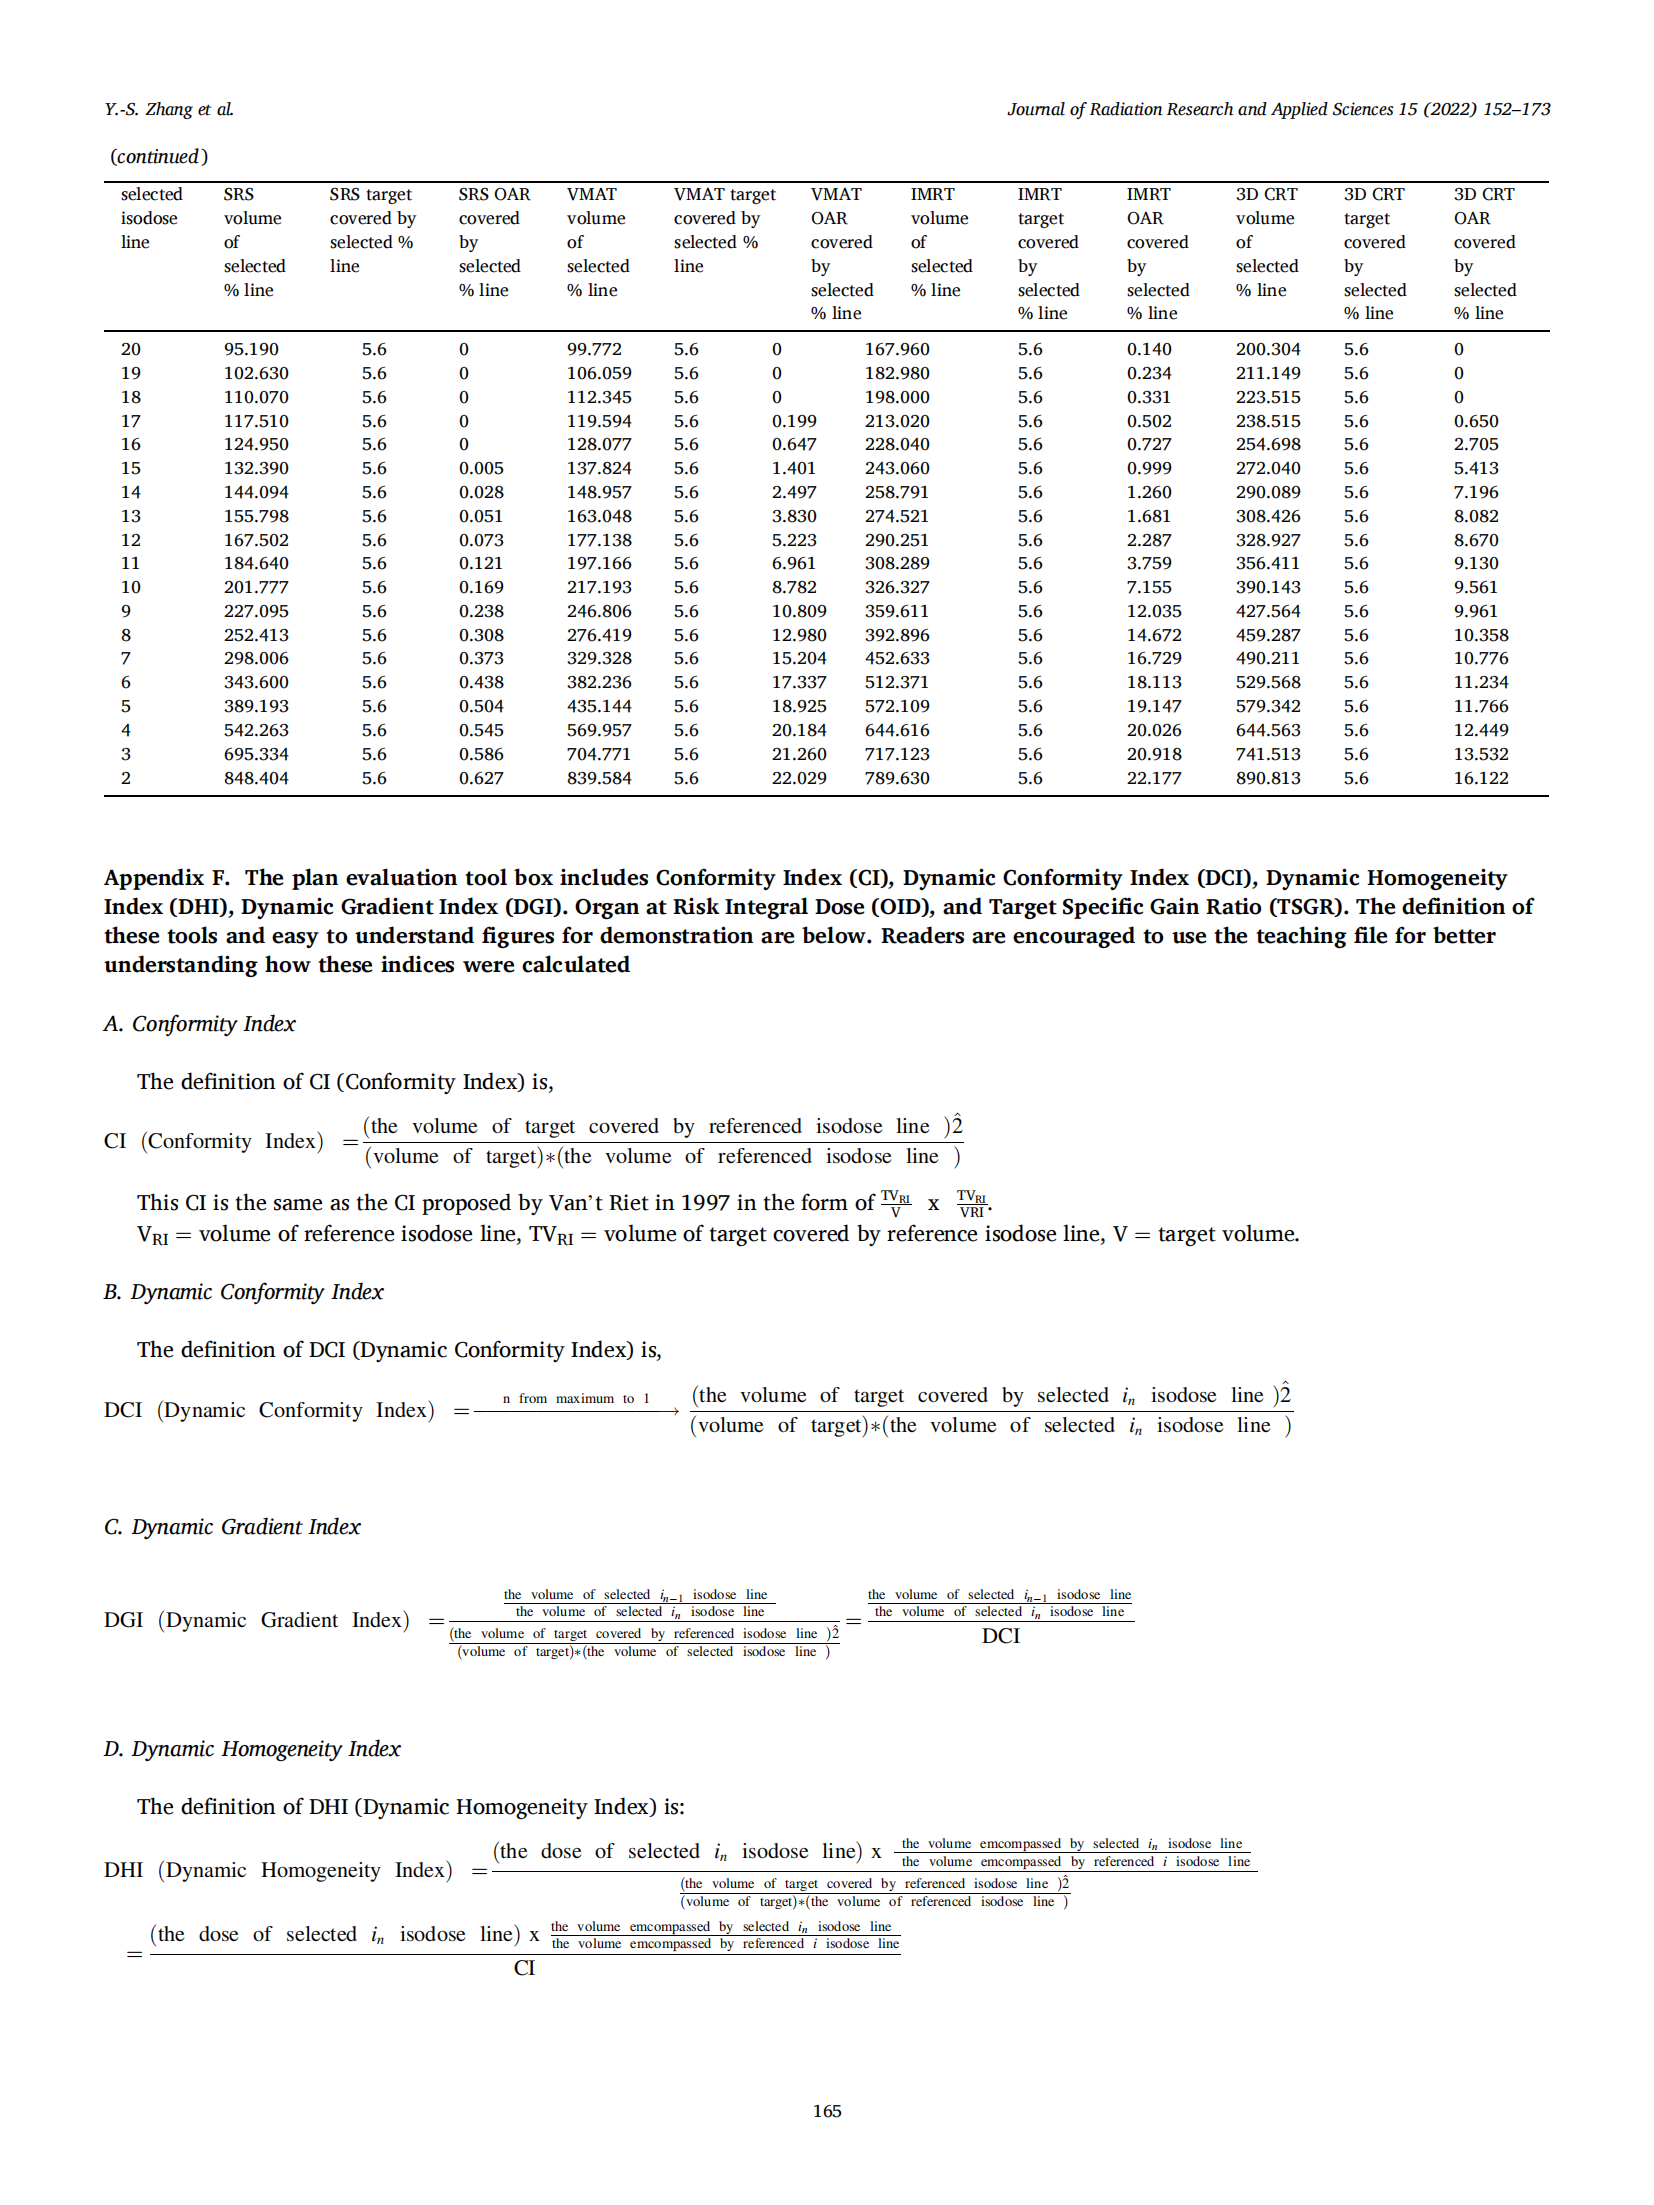
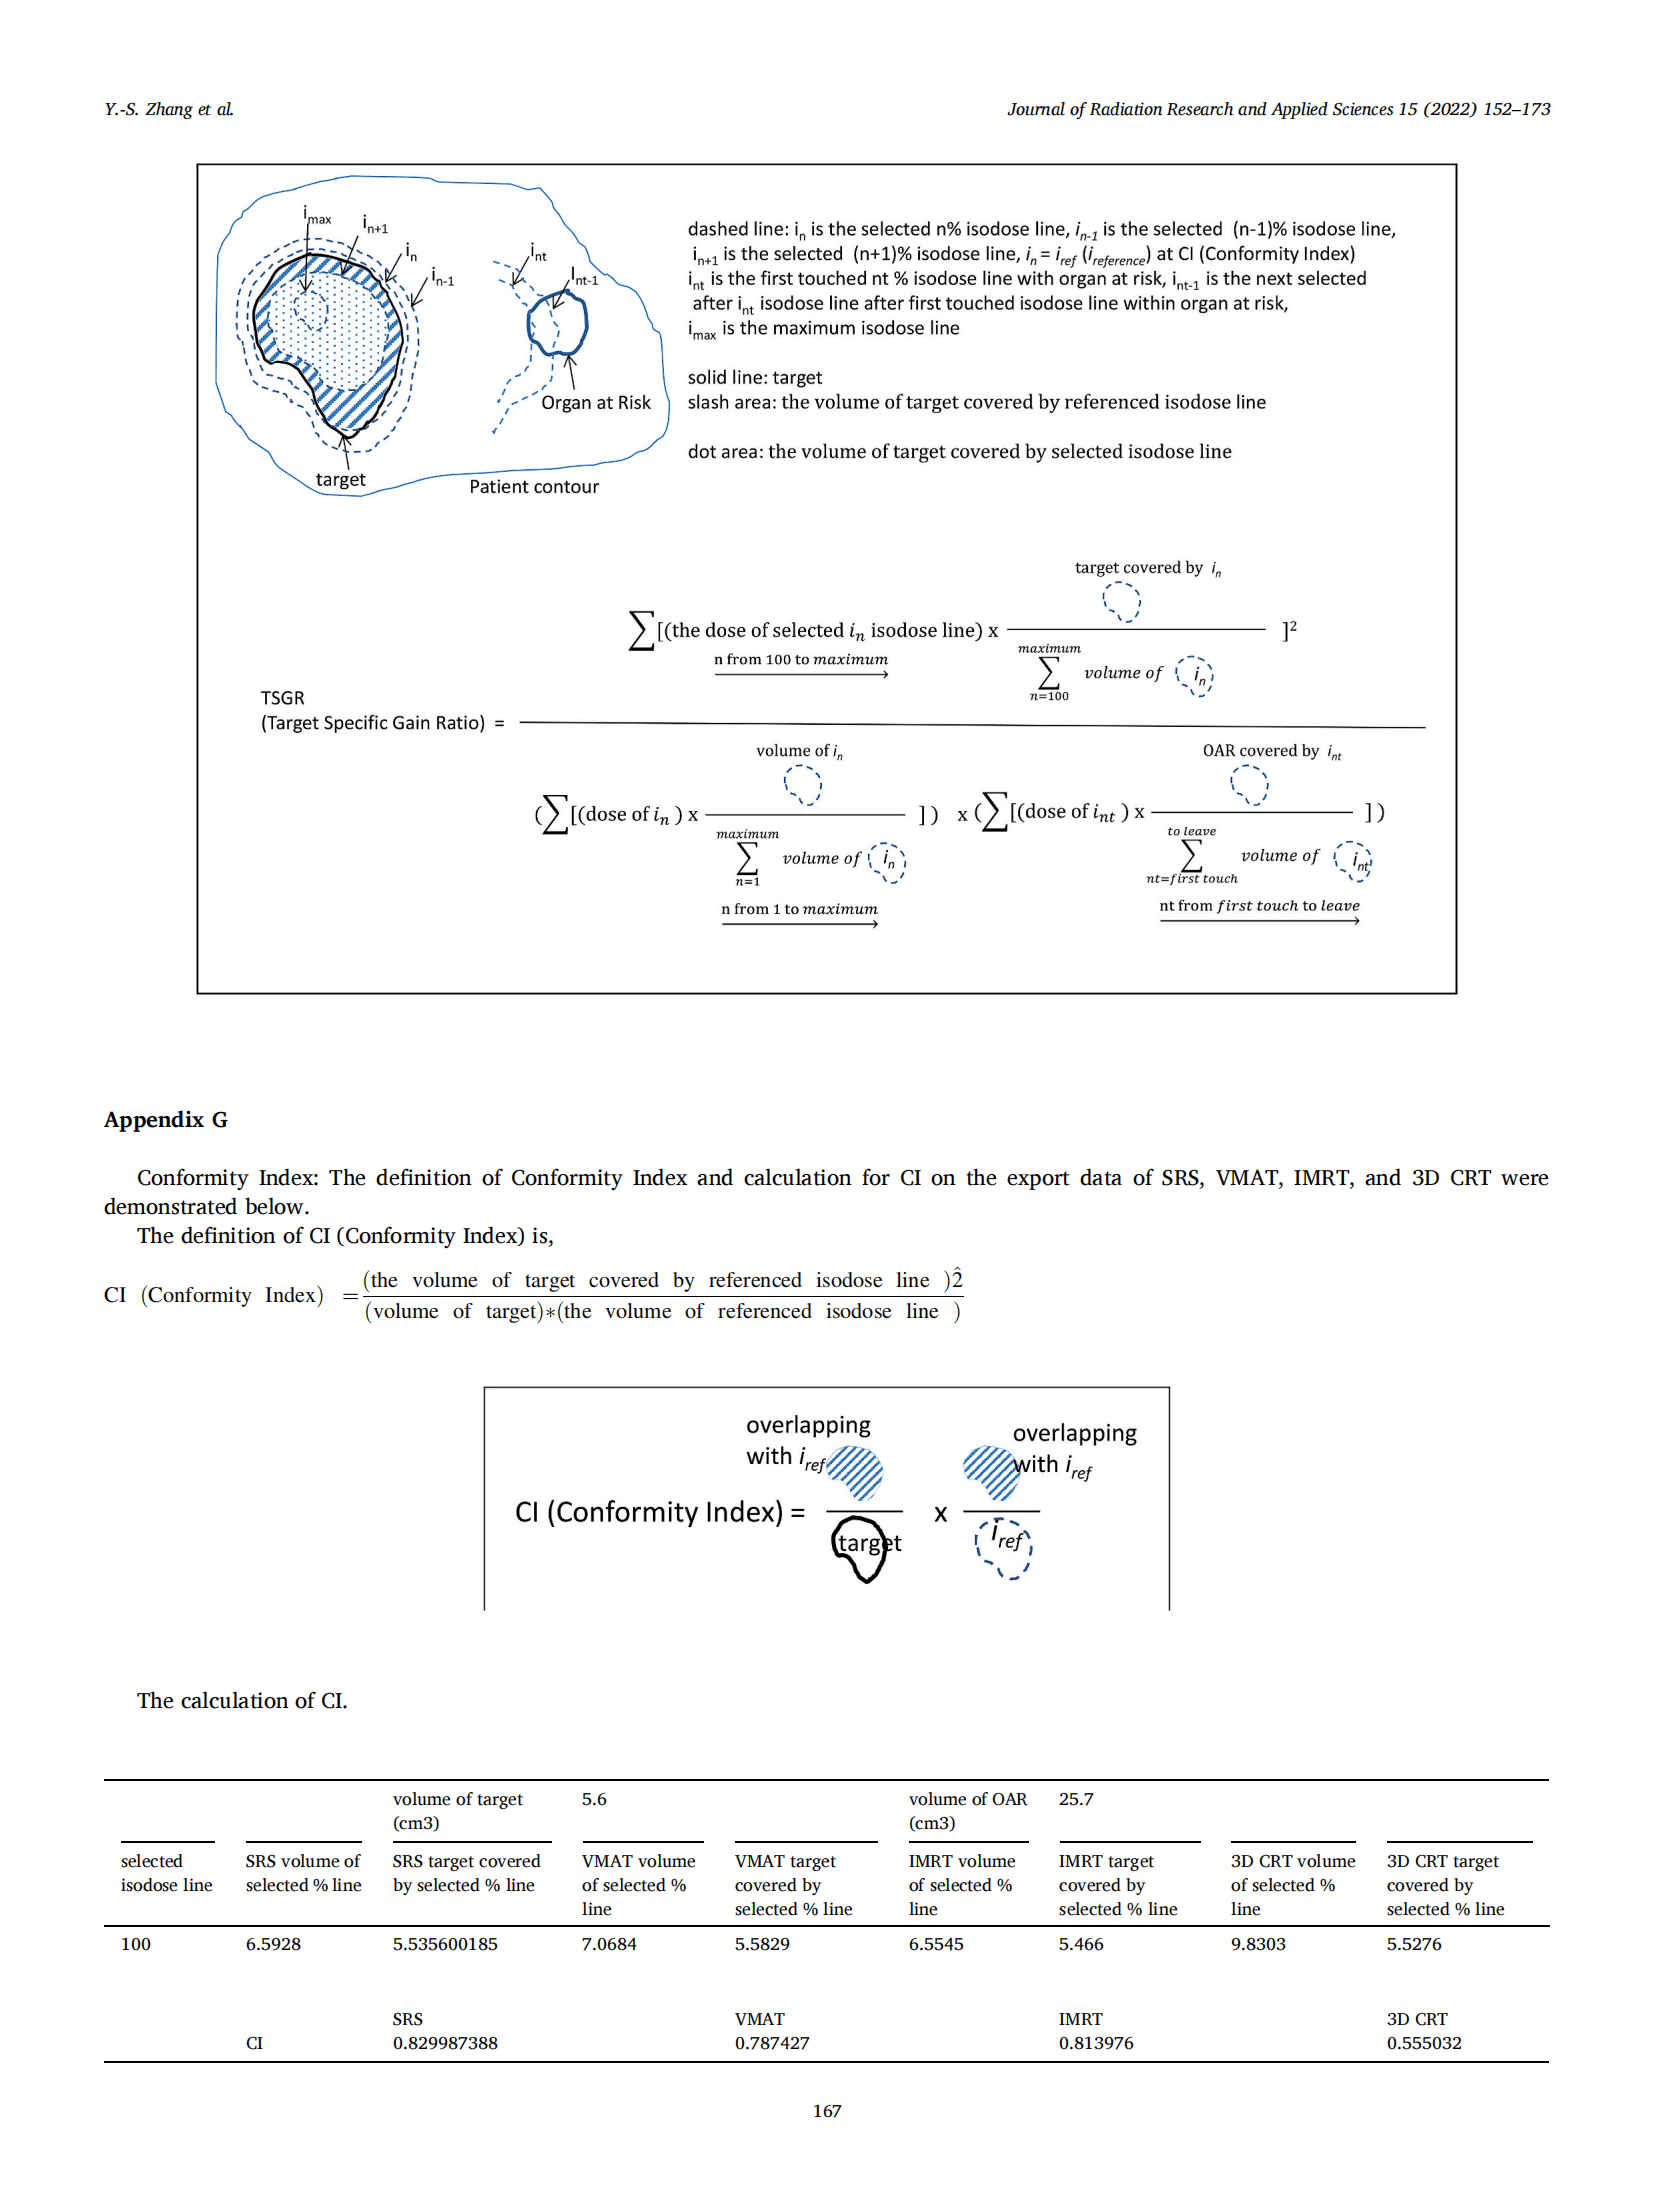
3. Conformity index
This CI is the same as the CI proposed by Van’t Riet in 1997 in the form of .Please refer to Appendix F for detail of CI.
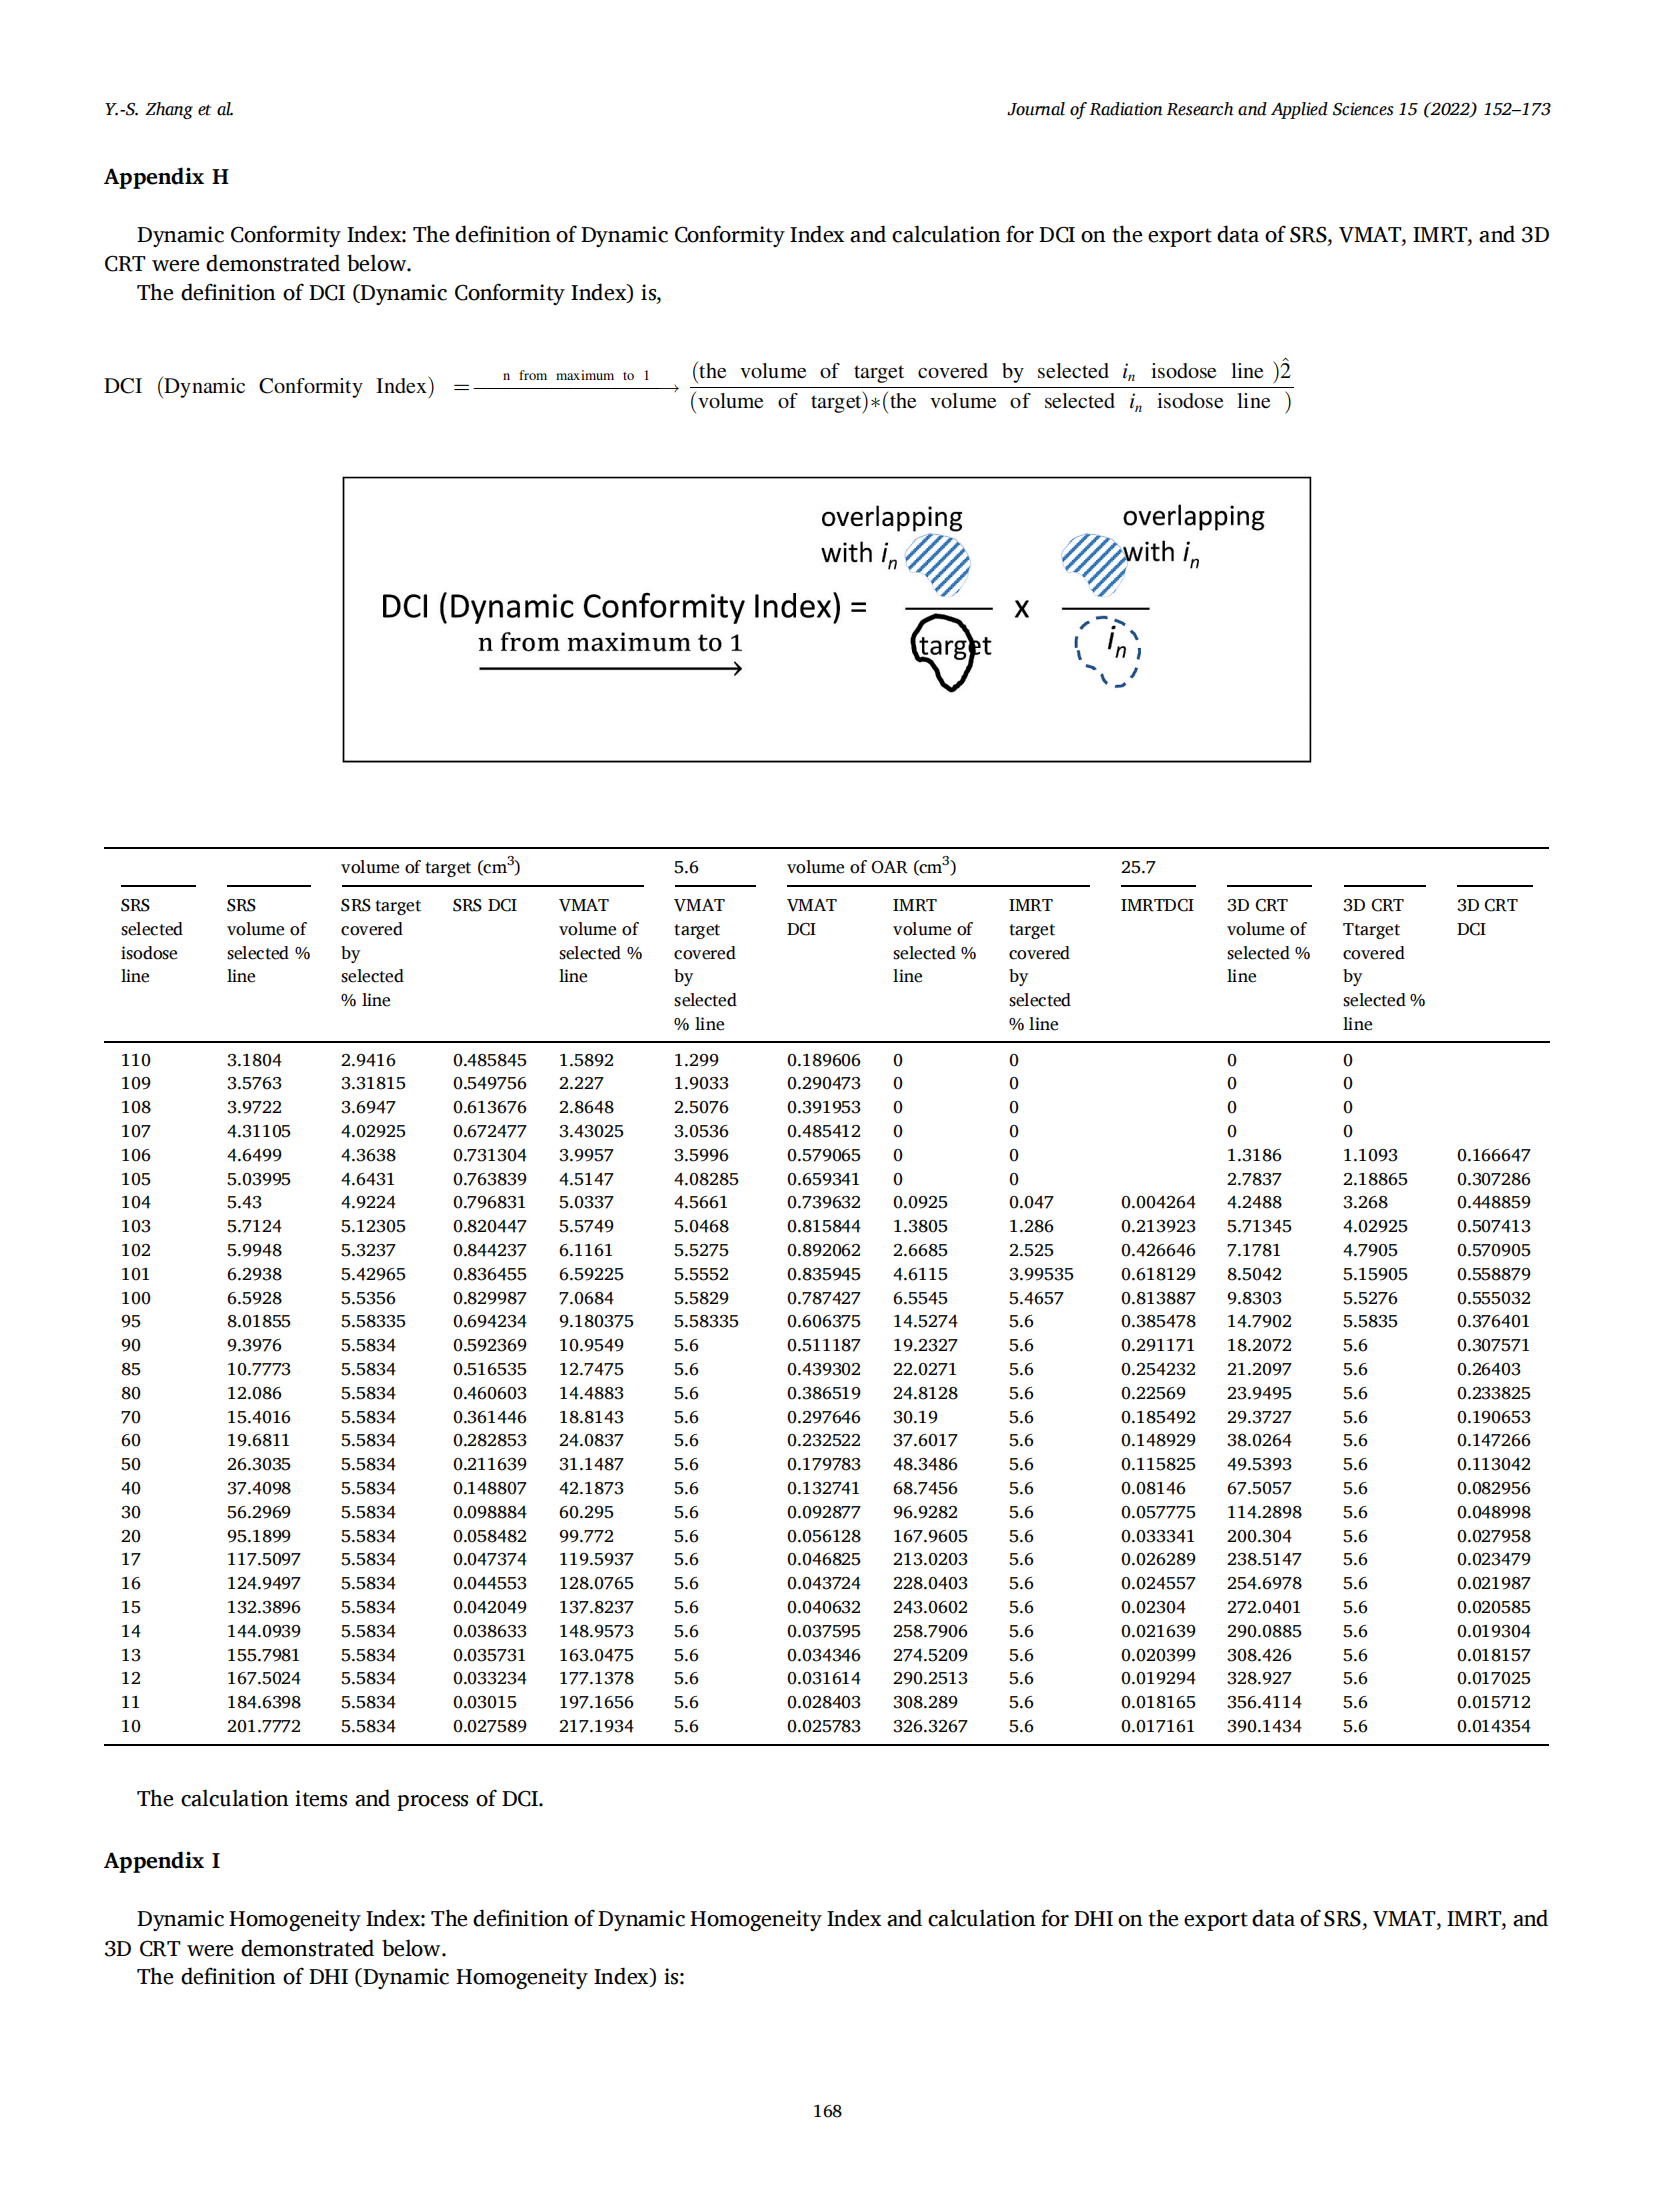
3.1. Dynamic gradient index
The definition of Dynamic Gradient Index (DGI) is:
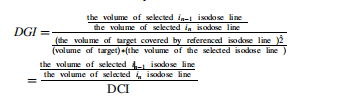
The DGI emphasizes a sequence of a larger isodose line to encompass the previous smaller isodose line and normalize to its DCI to analyze the glowing from line to line for every planning technique.
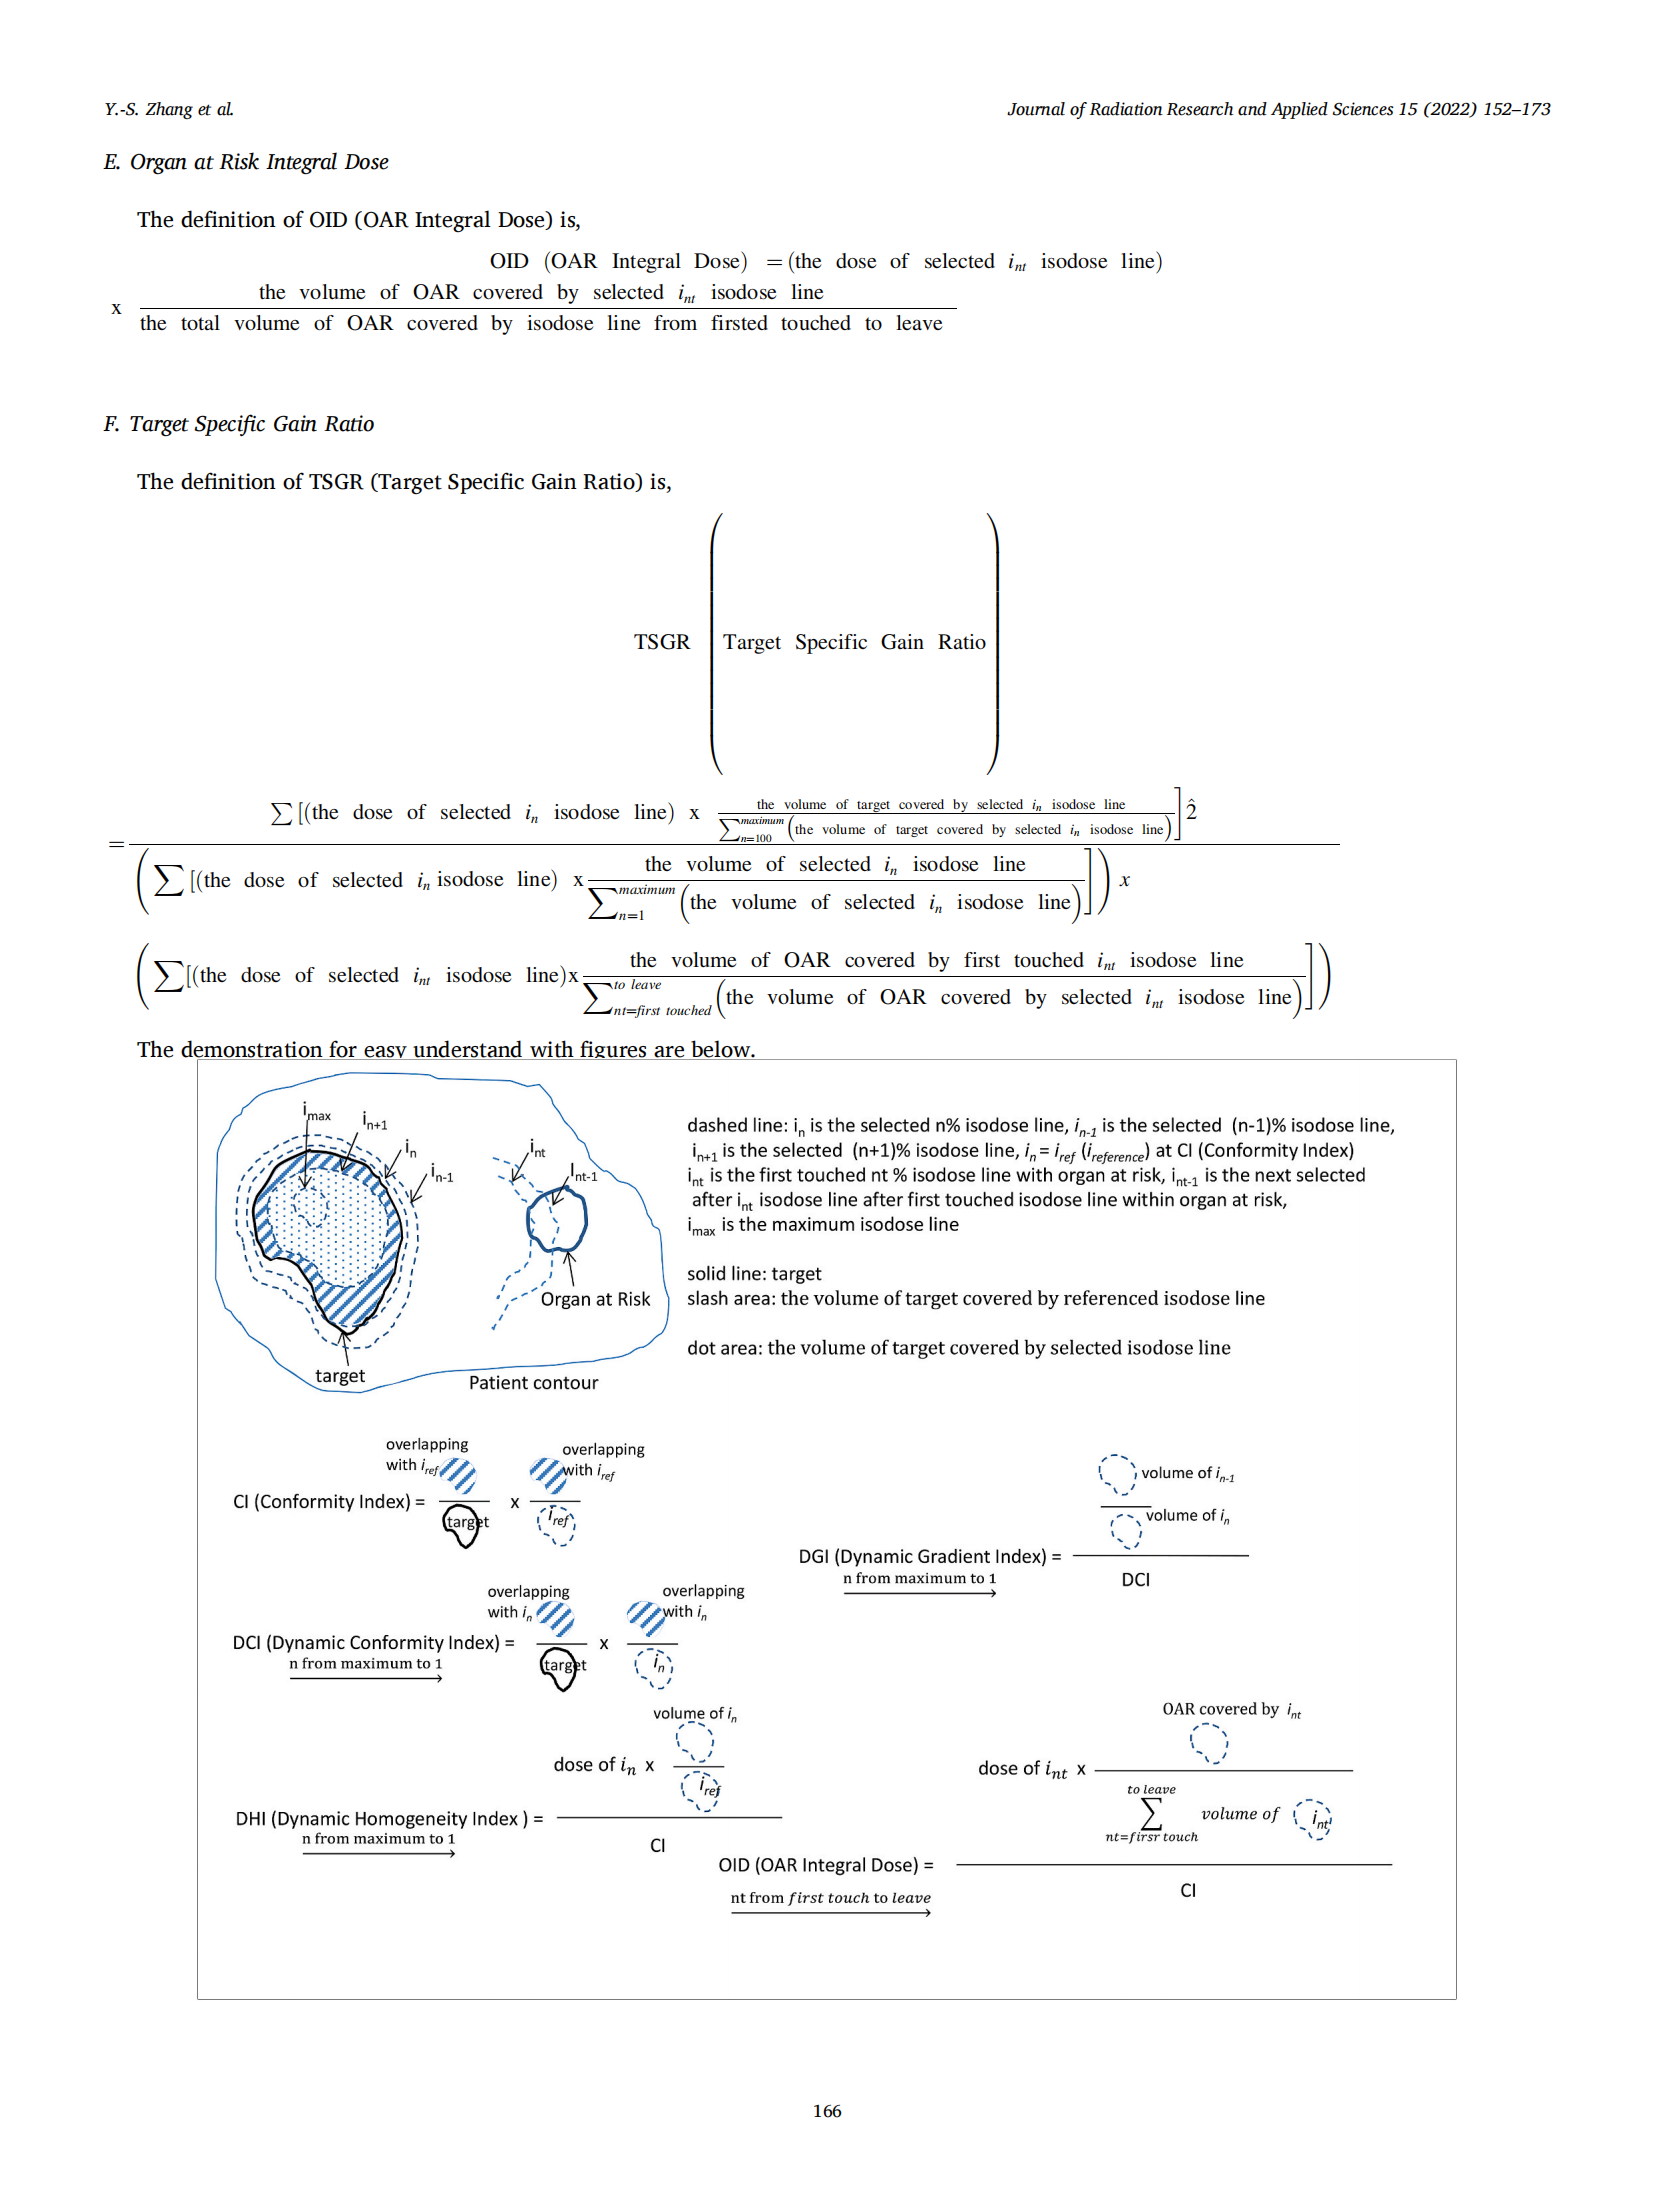
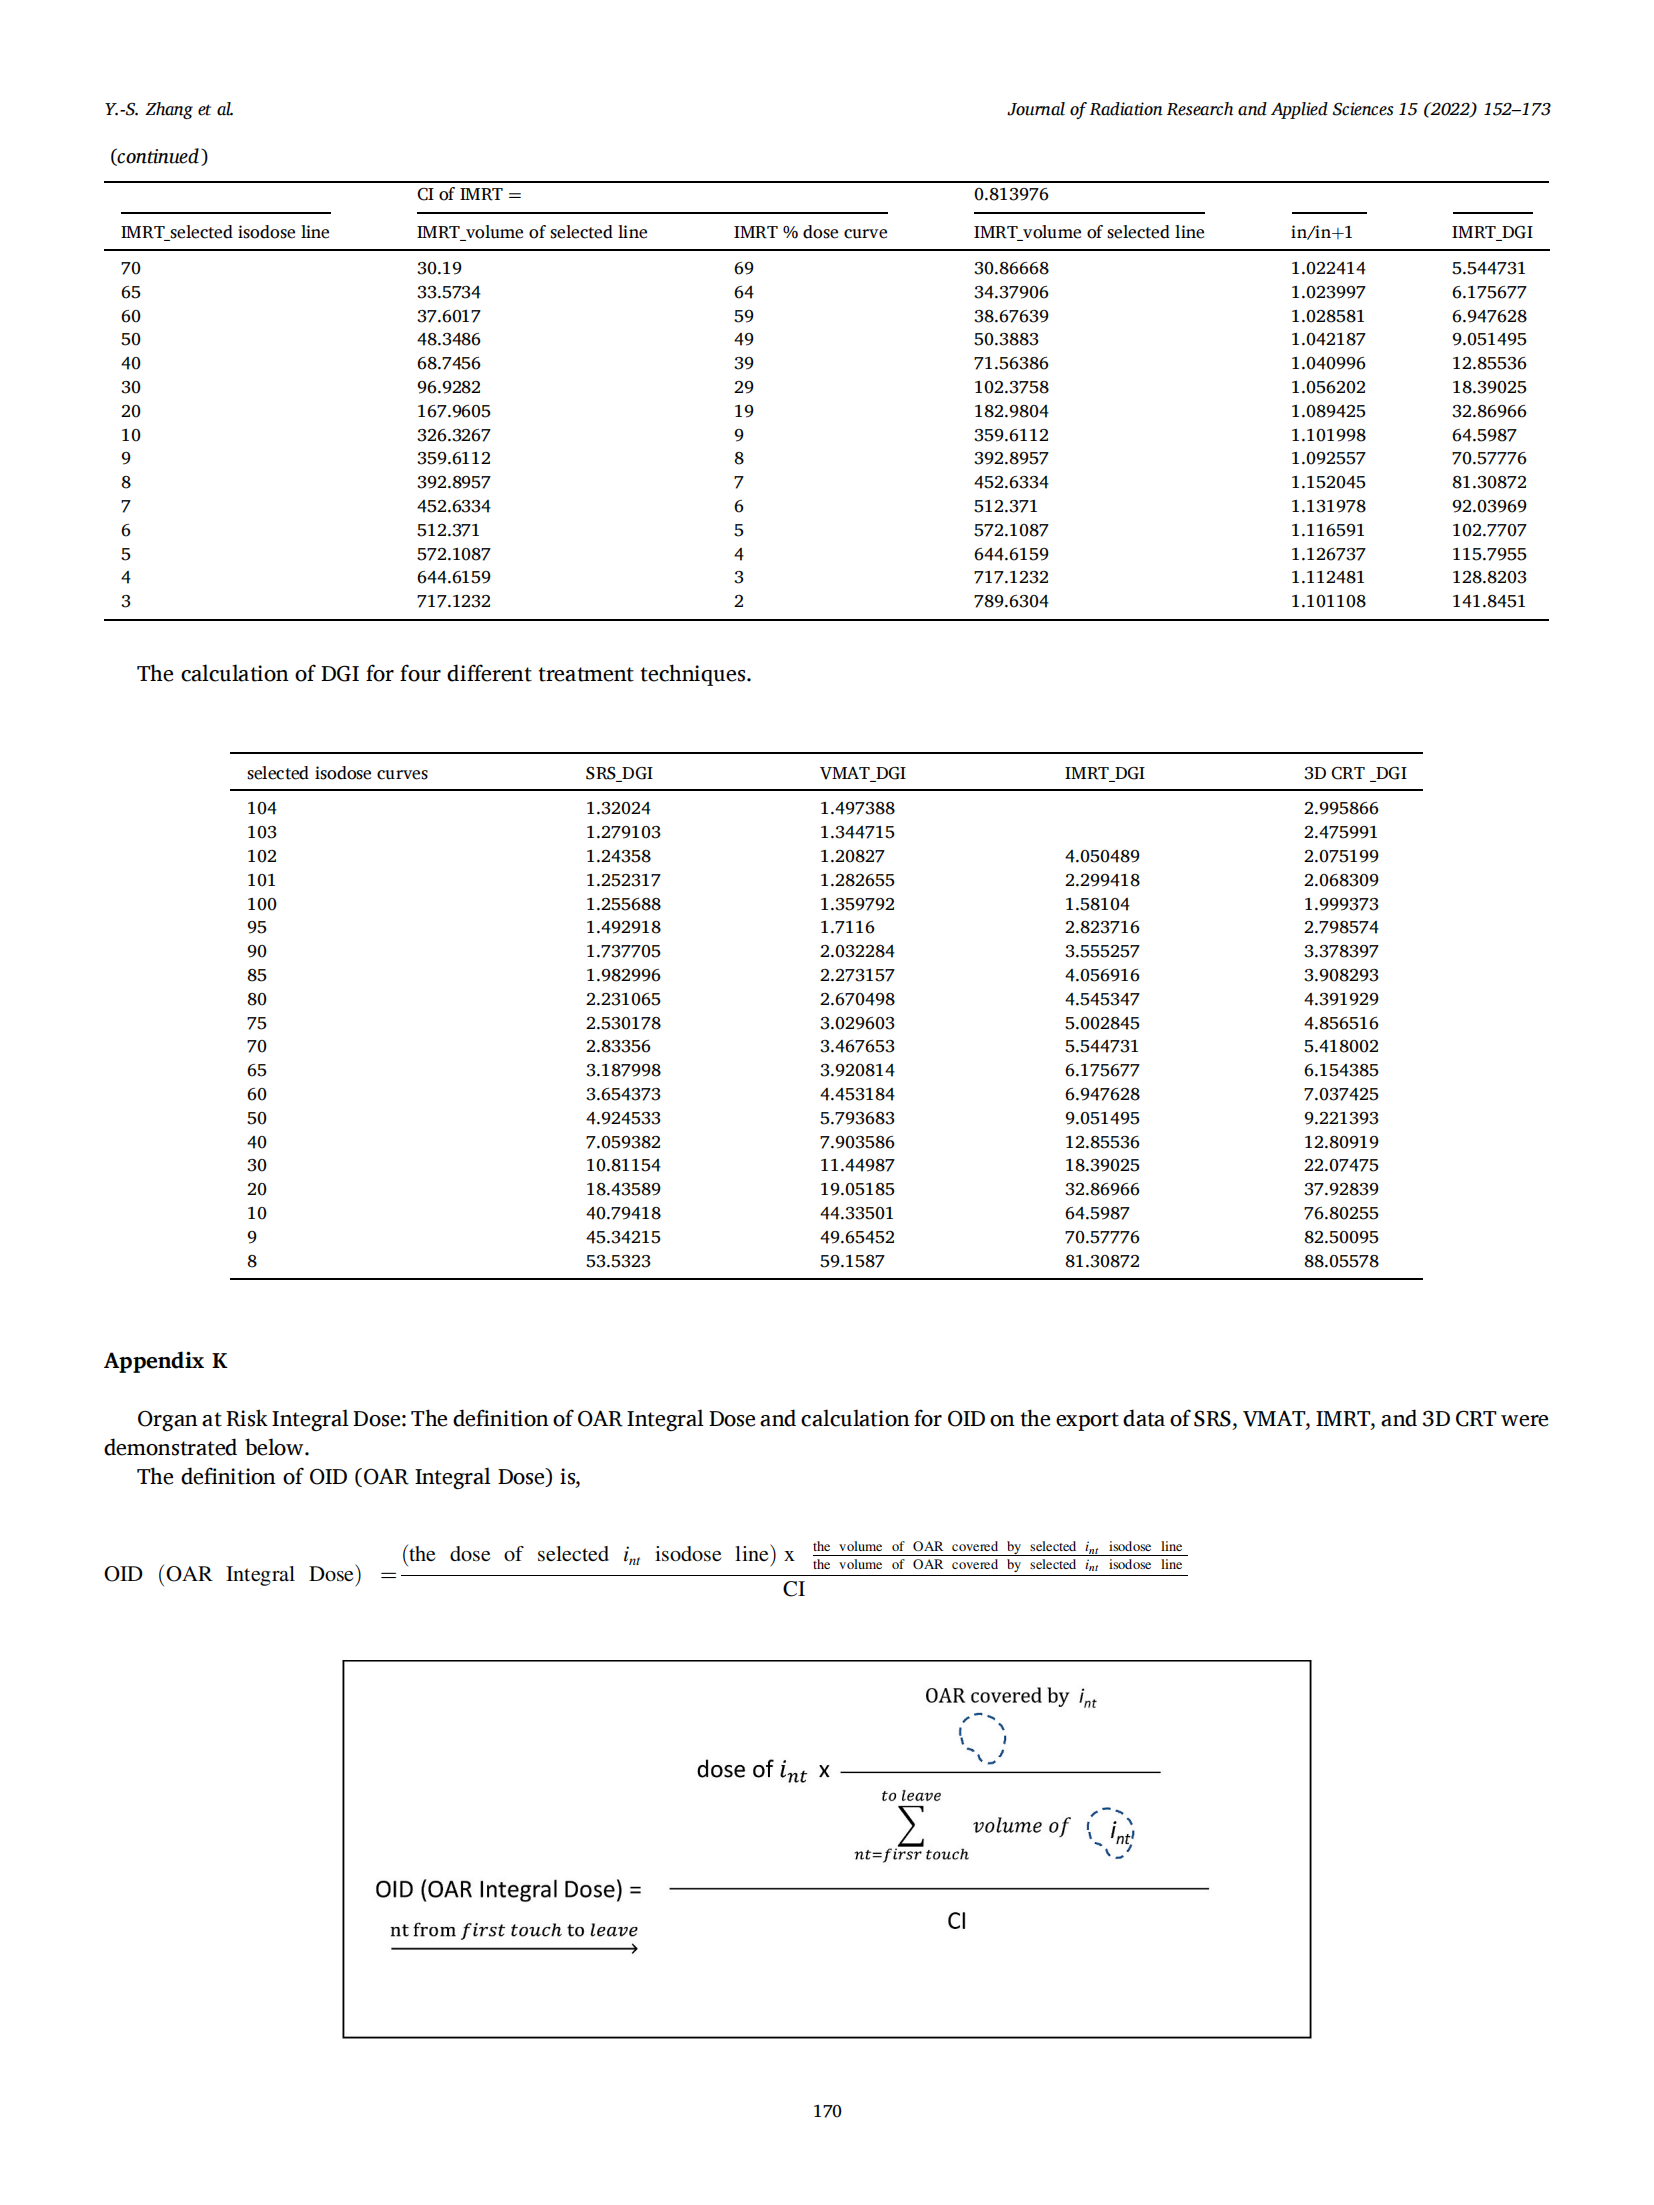
3.2. The organ at risk integral dose
The definition of OAR Integral Dose (OID) is:
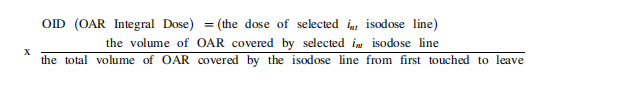
The OID calculates the integral dose of OAR for determination of that either target coverage or OAR sparing is compromised.
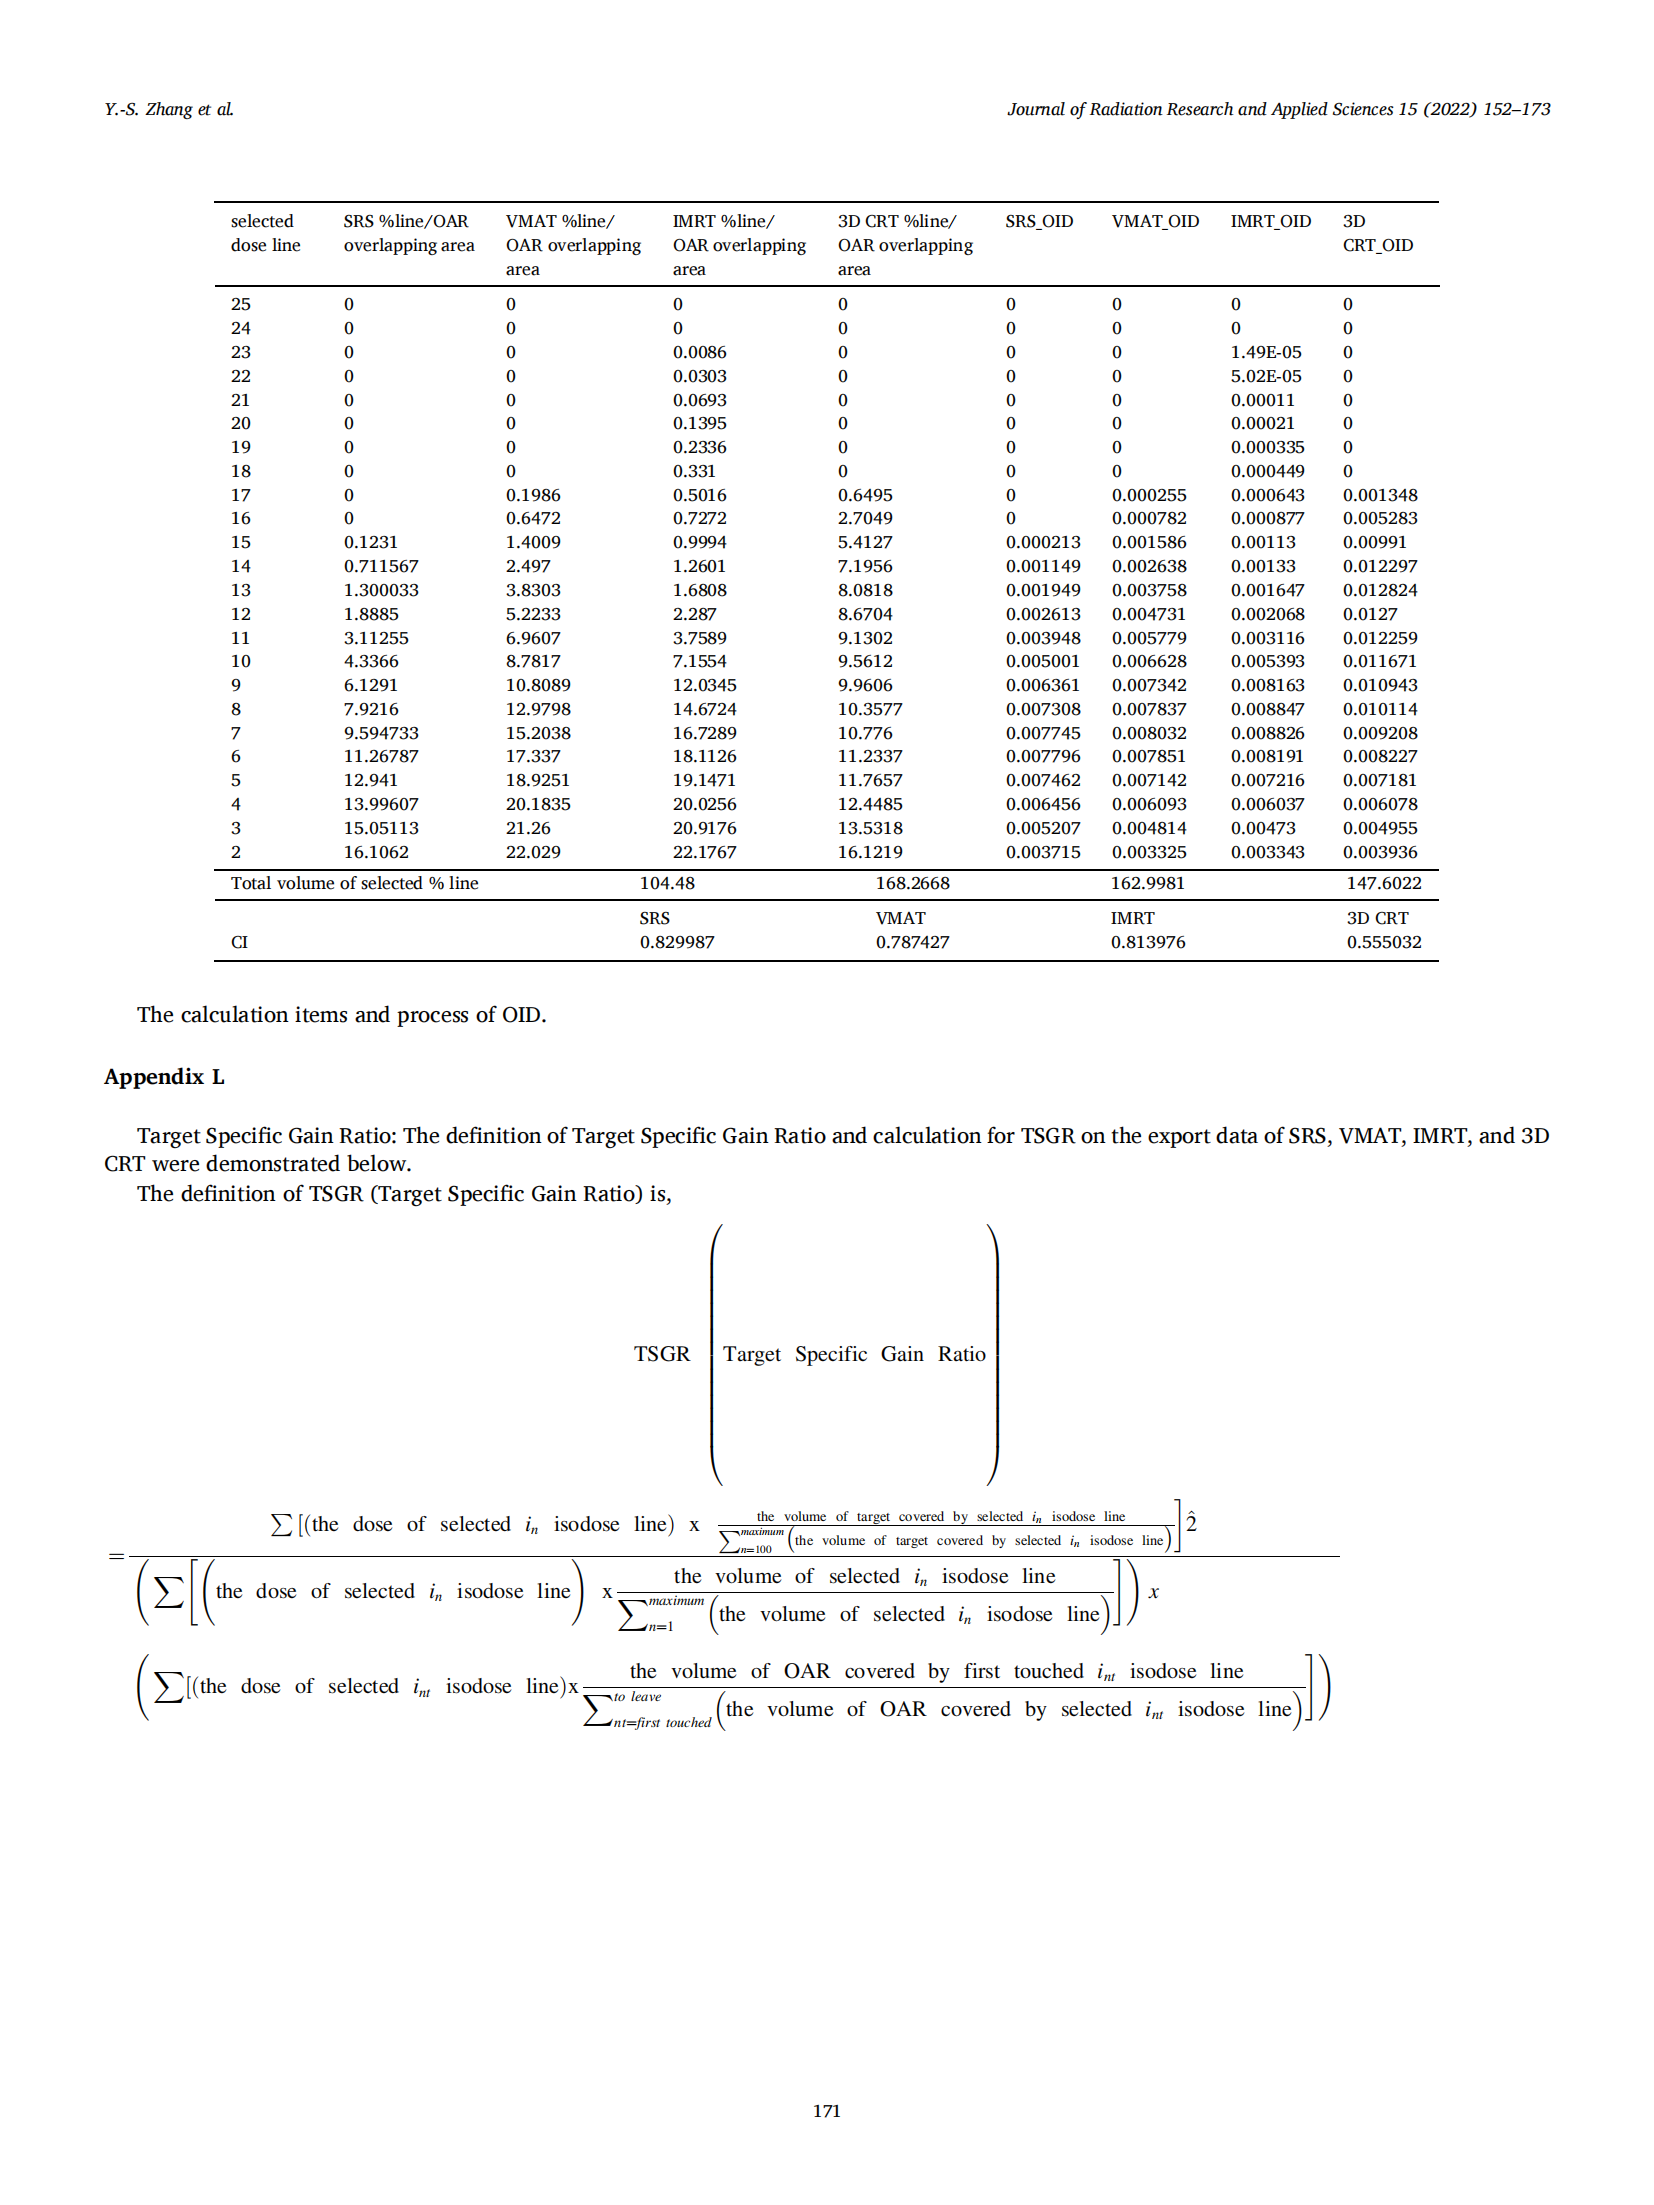
3.3. Target specific gain ratio
The definition of Target Specific Gain Ratio (TSGR) is:
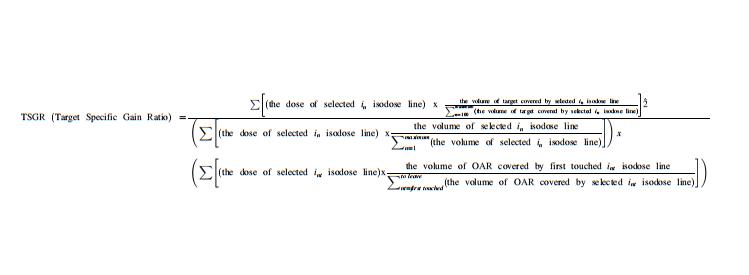
The TSGR provides the final judgment for pros and cons tangled cases especially in high precision and hypofractionated patients. The published gradient-related indices were also compared with DGI in the following.
The EFOD proposed by Lucullus Leung et al., in 1999.
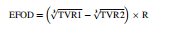
where.
The treatment volume ratio (TVR), as the ratio of the target volume to the treatment volume TVR = TV/VRI, EFOD = Equivalent fall off distance TVR1 and TVR2 is a target volume ratios for dose values under consideration, R is the equivalent radius of the target volume. CGI proposed by Wagner et al., in 2003.
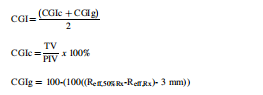
Where.
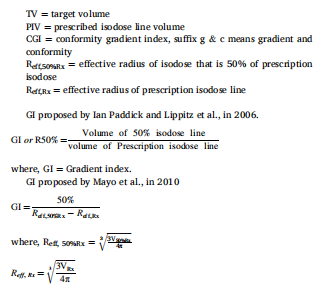
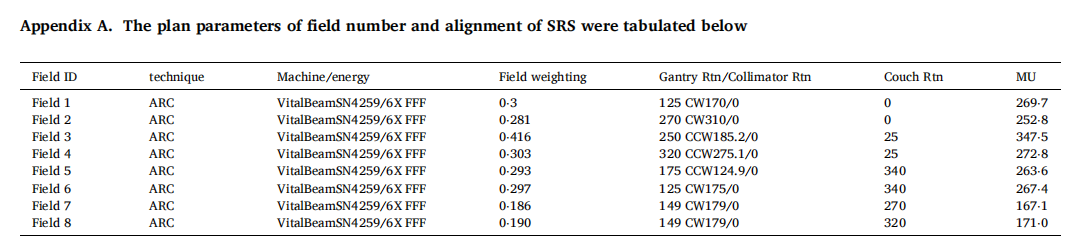
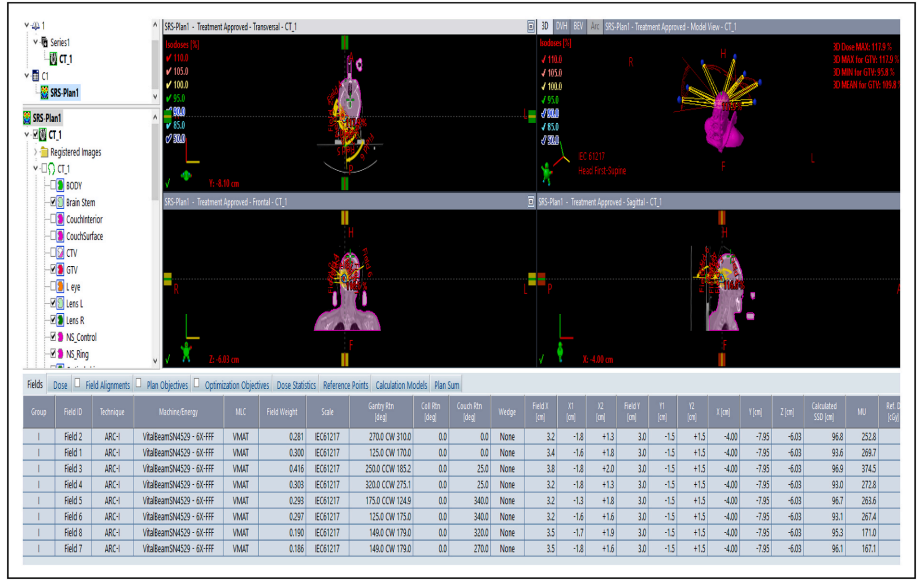
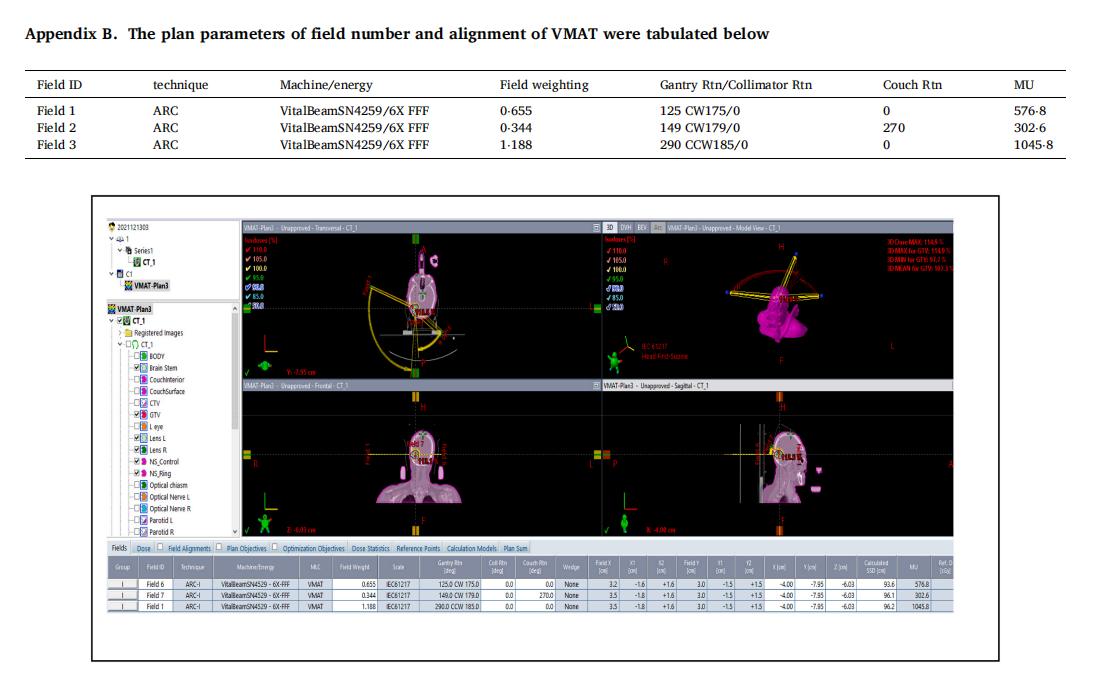
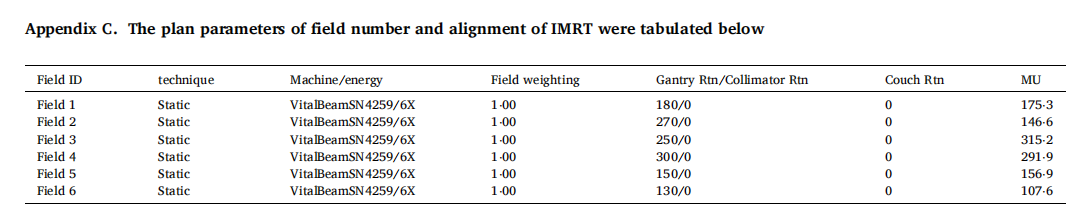
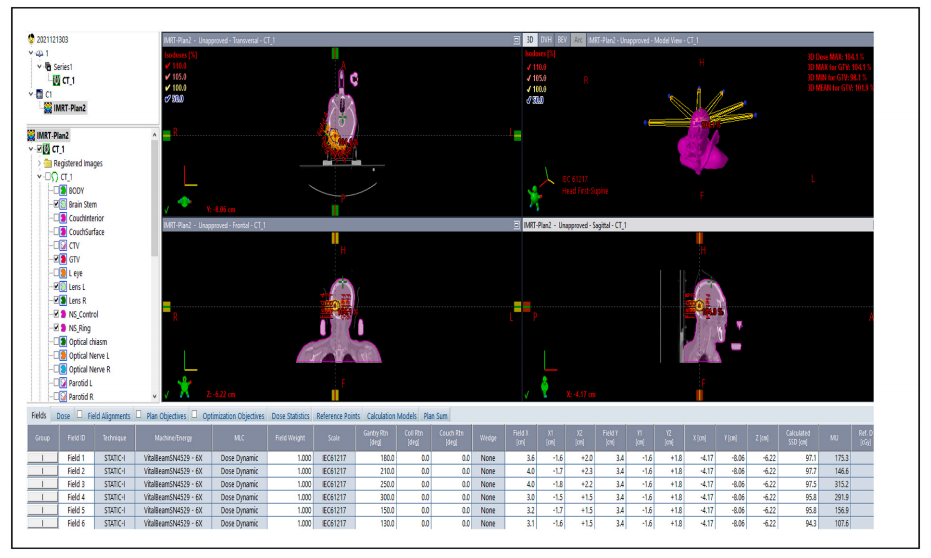
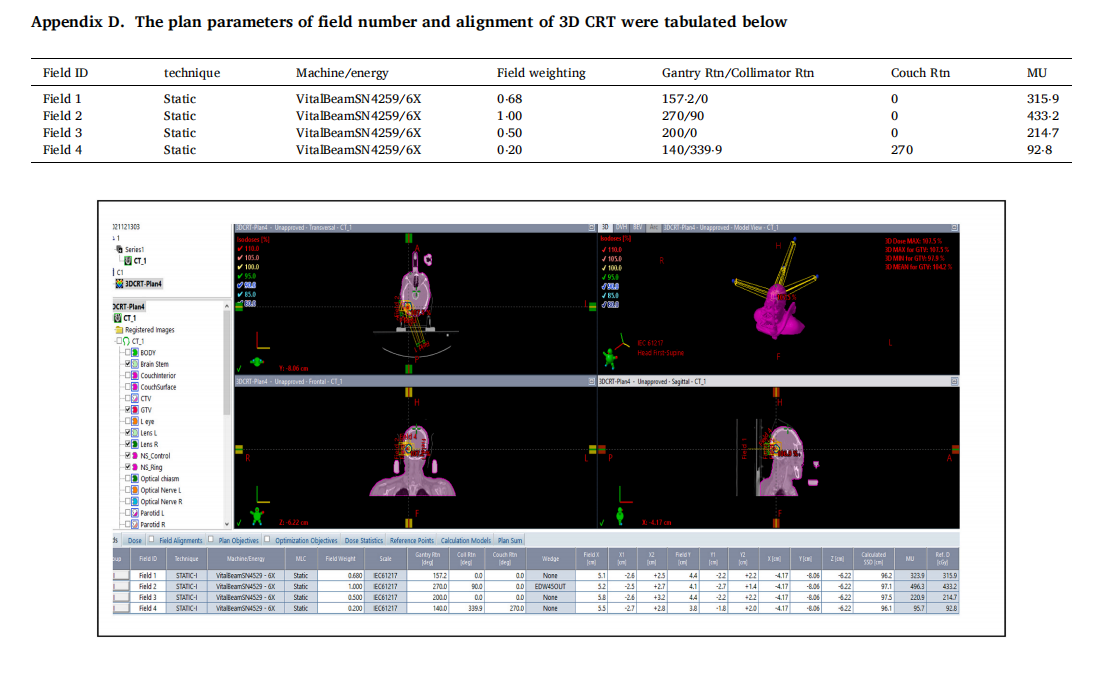
VRX and V50%RX are the volume of prescription isodose and 50% prescription isodose curves. Journal. The readers are pleased to refer to the clinical use of this plan evaluation tool for testing and demonstration by a case of meningioma in Appendix A to L or by using the teaching file provided by the author for demonstrating how all the indices were calculated. The prescribed dose was 2700 cGy in 3 fractions of SRS. Both SRS and VMAT, IMRT, 3D CRT were normalized to 100% prescribed to 100% target volume (GTV with safe margin) for comparison. Dmax of brain stem <18 Gy. Dmax of optic chiasm <15 Gy. Dmax of optic nerve <15 Gy. Dmax of eyeball <15 Gy. Dmax of lens <3 Gy. The volume of target and brain stem (OAR) are 5⋅6 cm3 and 25⋅7 cm3 , respectively. The treatment Planning system of Eclipse 15.5 (Varian Medical Systems, Palo Alto, CA, USA) was adopted for the test and demonstration in this study.
4. Results
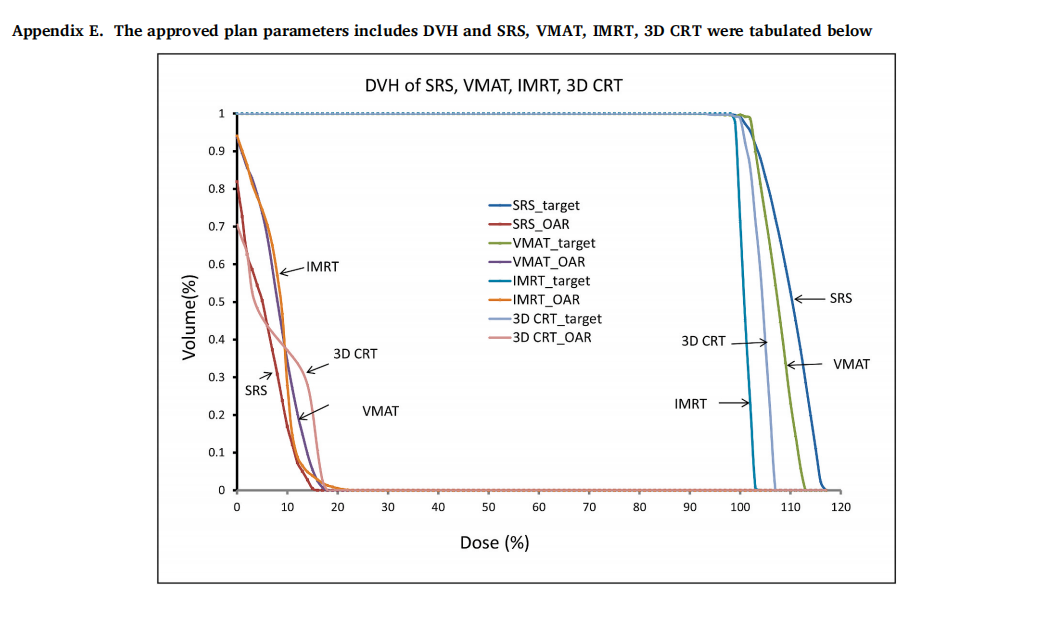
The best results of four different treatment techniques SRS, VMAT, IMRT, and 3D CRT normalized to 100% prescribed of 2700 cGy to 100% target volume was shown on DVH in Appendix E. All plans satisfy the dose constraints of Dmax of brain stem <18 Gy. Dmax of the optic chiasm, optic nerve, and eyeball were all <15 Gy and Dmax of lens <3 Gy.
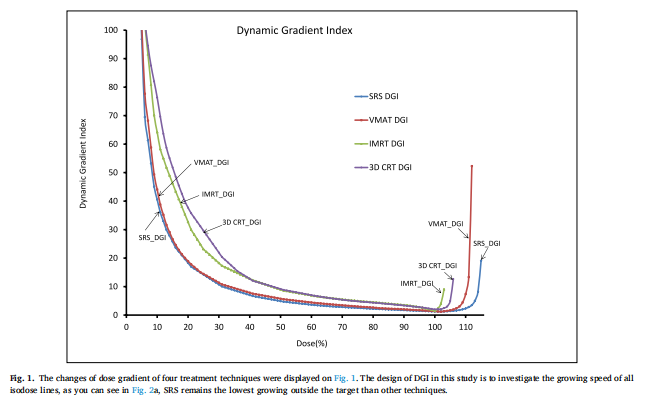
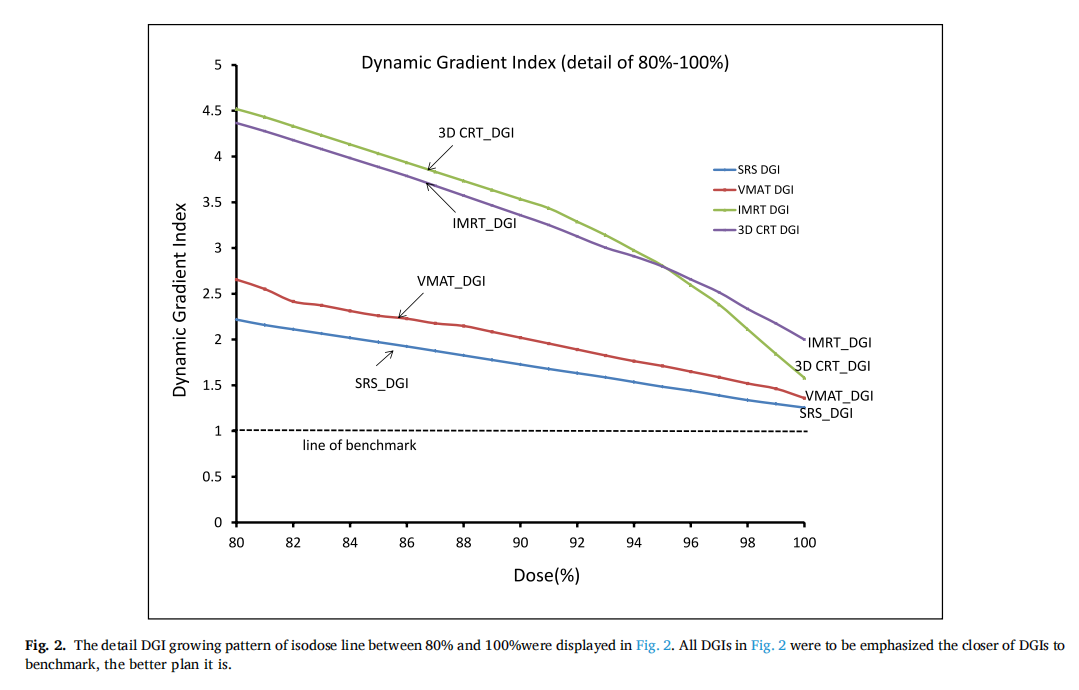
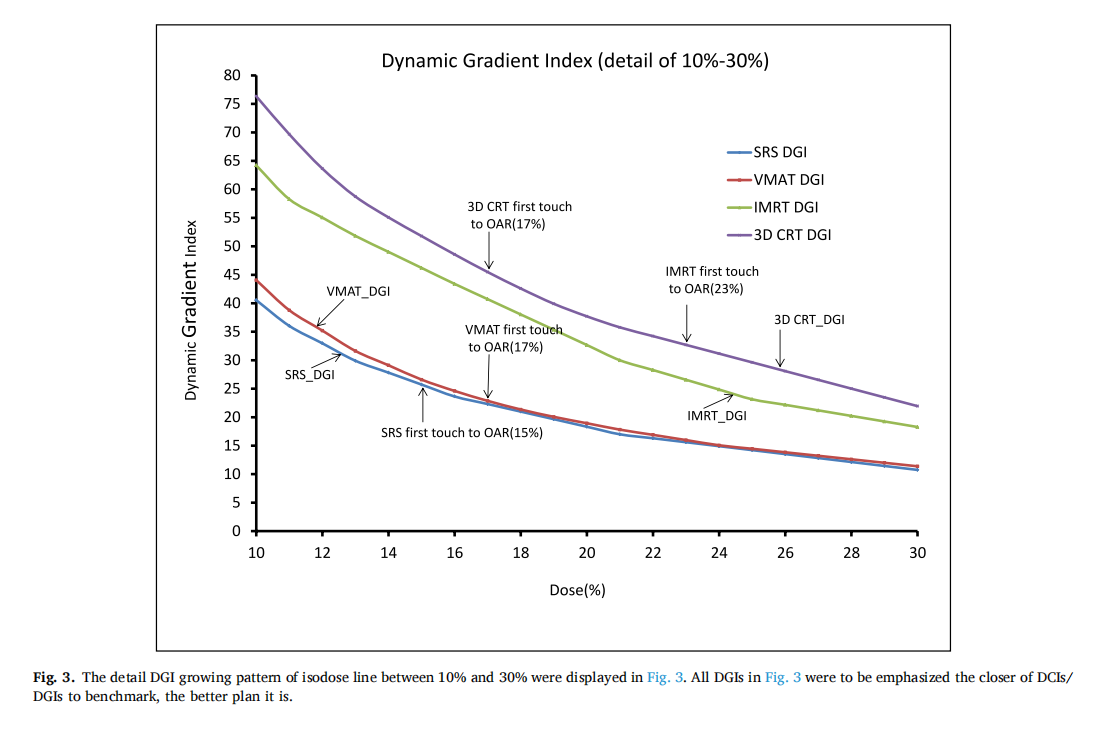
The physicians and physicists would like to know the dose gradient inside and outside the target, the changes of dose gradient of four treatment techniques were displayed in Fig. 1, planners were expected to have a CI or DCI close to the line of the benchmark with the value of 1.The design of DGI in this study is to investigate the growing speed of all isodose lines, as you can see in Fig. 2, SRS remains the lowest growing outside the target than other techniques. The detailed DGI growing pattern of an isodose line between 80% to 100% and 10%–30% were displayed in Fig. 3. Figs. 2 and 3 show the results to be emphasized the closer of DGIs to benchmark, the better plan it is.
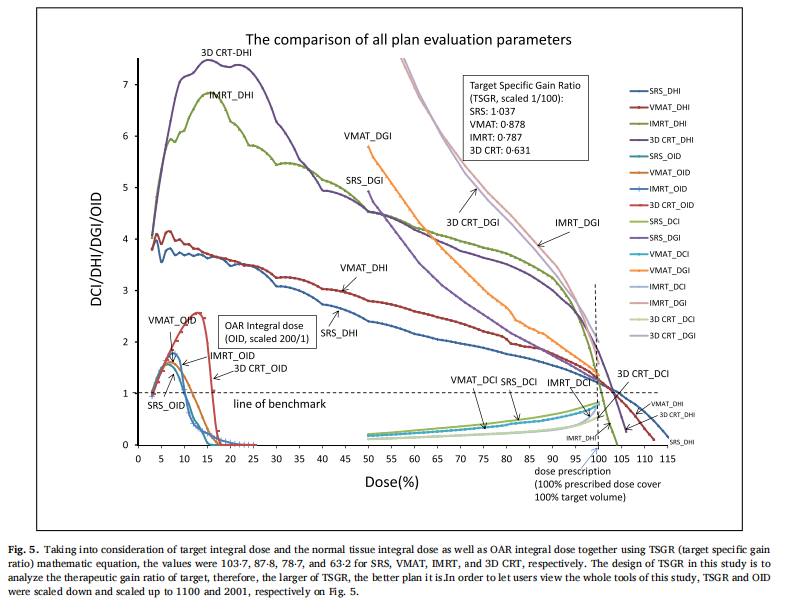
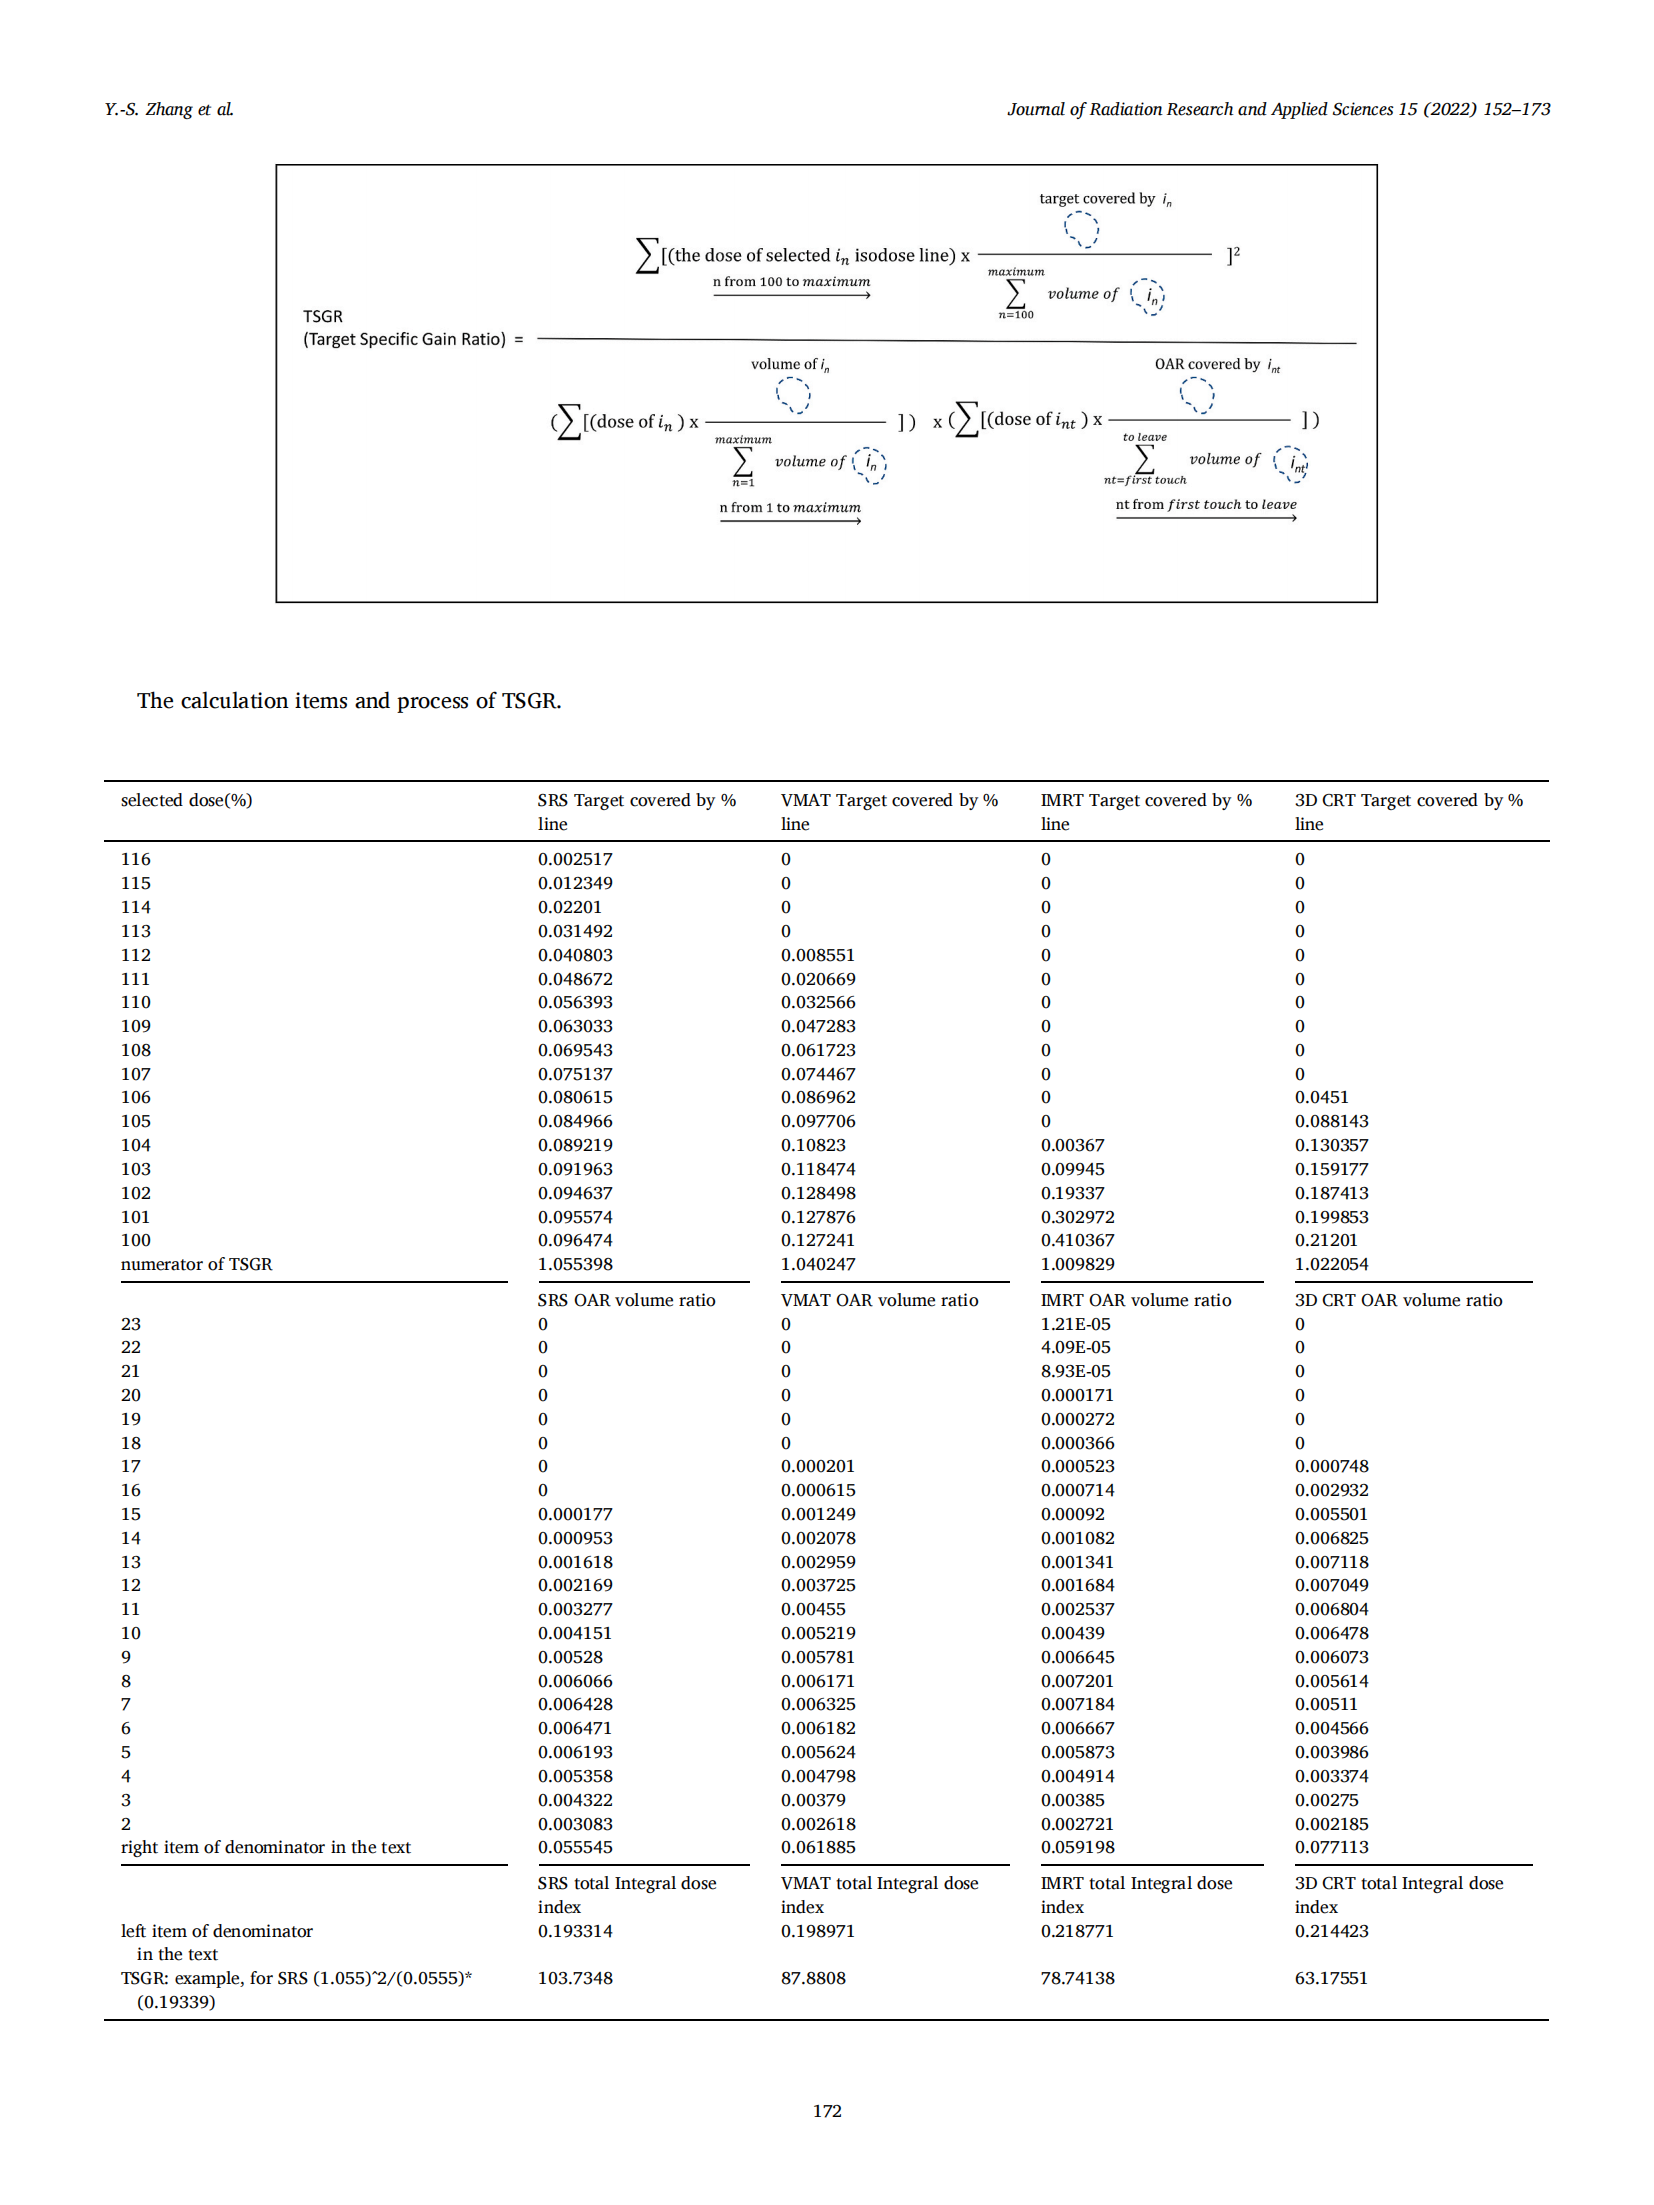
Taking into consideration of target integral dose and the normal tissue integral dose as well as OAR integral dose together using TSGR mathematic equation, the values were 103⋅7, 87⋅8, 78⋅7, and 63⋅2 for SRS, VMAT, IMRT, and 3D CRT, respectively. The design of TSGR in this study is to analyze the therapeutic gain ratio of the target, therefore, the larger of TSGR, the better plan it is. To let user view the whole tools of this study, TSGR and OID were scaled down and scaled up to 100 1 and 200 1 , respectively in Fig. 5.
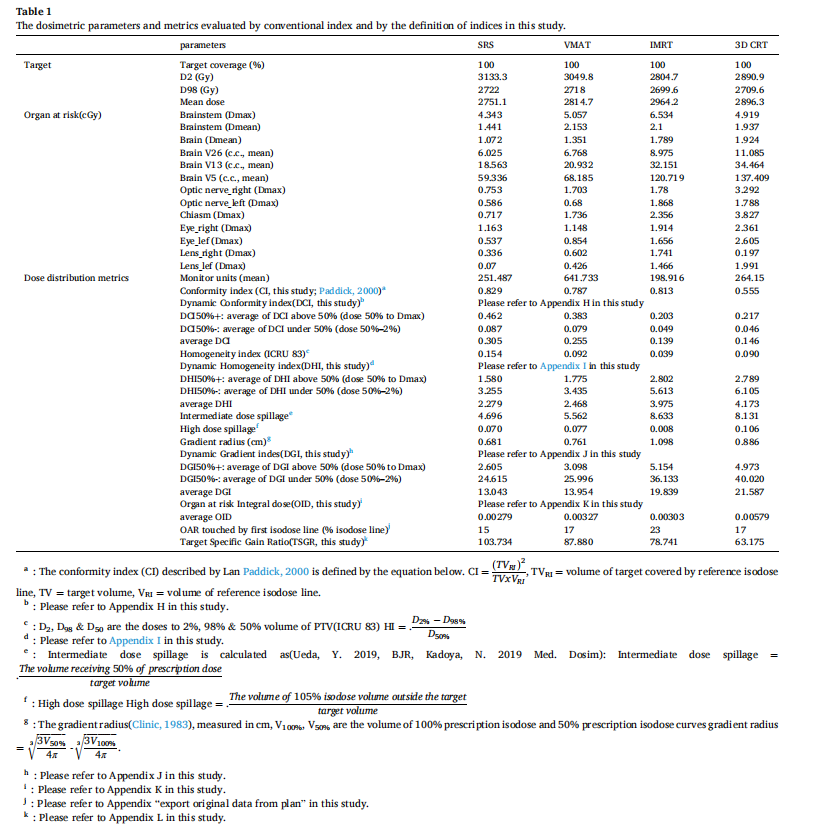
Table 1 lists all treatment plan dosimetric parameters of target coverage, the organ at risk, dose distribution metrics for conventional indices, and the calculation results in this study. A close to zero HI indicates the dose distribution is superior, but the HI of SRS is the largest, and IMRT is the smallest one.
Furthermore, the optical nerve of let side, intermediate dose spillage, gradient radius for IMRT were all larger than 3D CRT which confuses radiation oncologists and medical physicists decide for what plan is better in consideration for all aspects.
5. Discussion
As you can see, the best results shown on DVH in Appendix E of four different treatment techniques SRS, VMAT, IMRT, and 3D CRT was confused for the physician to make the decision which plan is the best. This is because DVH can provide quick information about the dose coverage of the target volume, however, cannot determine how good the treatment plan is and where is the dose disturbance located. A very impressive DVH of target volume could be a false score. For example, using a 35-mm diameter collimator to produce a spherical dose distribution to cover a 15-mm diameter spherical target volume entirely results in an almost perfect DVH result.
The calculated CI of four treatment techniques were 0⋅8299, 0⋅7872,0⋅8139, and 0⋅5550 for SRS, VMAT, IMRT, and 3D CRT, respectively. When comparing the target coverage and the OAR sparing of IMRT and VMAT solely on DVH, and the CI of IMRT for 0⋅8139 and VMAT for 0⋅7872, it seems to imply the plan for IMRT is better than VMAT. A determination of the superiority of plans must deal explicitly with more and all aspects examination.
The calculated CI was denoted in Fig. 1 with four DCIs. You may notice the single value of CI for IMRT is higher than VMAT in Fig. 1. As a previous discussion, this may lead physicians to make a wrong decision for choosing IMRT rather than VMAT. When taking a look at CIs for the rest of the isodose lines of VMAT, the CIs were higher close to the line of a benchmark than the rest of IMRT was. According to the definition of CI and DCI, planners were expected to have a CI or DCI close to the line of the benchmark with the value of 1. When we exam the single CI of IMRT for 0⋅8139 and 0⋅5550 for 3D CRT, it seems much better for IMRT than 3D CRT, but the rest of the CIs show almost the same which highlight the importance of dynamic conformity index as a crucial factor for determining the plan superiority.
The dose gradient inside and outside the target volume was concerned by the physicians and physicists. The nominator of DGI is designed for the area covered by a larger isodose line divided by a smaller area covered by a higher isodose line. The function of DGI successfully reflects the advantage of fast expanded isodose lines (low dose gradient) could be easily examined. The plan superiority is determined by how close the DGI and the other indices are to the line of the benchmark.
The growing speed of DGI for the SRS curve is slower similar to VMAT than the other two treatment techniques in Fig. 2a. The phenomenon reveals the isodose line expansion of SRS and VMAT are smaller than IMRT and 3D CRT which means the high dose lines are confined within a certain distance (plateau in between 100% and 35%)around 35% outside the target. The treatment technique of IMRT has a better dose gradient after 35% than 3D CRT according to Fig. 2a. The DGI of SRS beyond 100% inside the target area shows the advantage of the plateau between 100% and 110%, which means the change of dose gradient is smaller and this phenomenon could not be checked in DVH as well in other plan evaluation indices. The design of DGI in this study is to investigate the growing speed of all isodose lines, as you can see in Fig. 2a, SRS remains the lowest growing outside the target than other techniques. The detailed DGI growing pattern of the isodose line between 80% to 100% and 10%–30% were displayed in Fig. 2b in upper and lower sub-figure, respectively. The curve of SRS and VMAT remains superior to the other two techniques. The advantage of dose gradient of 3D CRT is superior to IMRT beyond 95% isodose line, while between this region the conformity of IMRT is better than 3D CRT in Fig. 2b on upper sub-figure. Fig. 2b on the lower sub-figure shows, the detail isodose line between 10% and 30%, the lower first touched isodose line with OAR, and the lower height of the touchpoint indicate the better plan it is. All DCIs were shown with DGIs in Fig. 2a and b to emphasize the closer of DCIs/DGIs are to the benchmark, the better plan is.
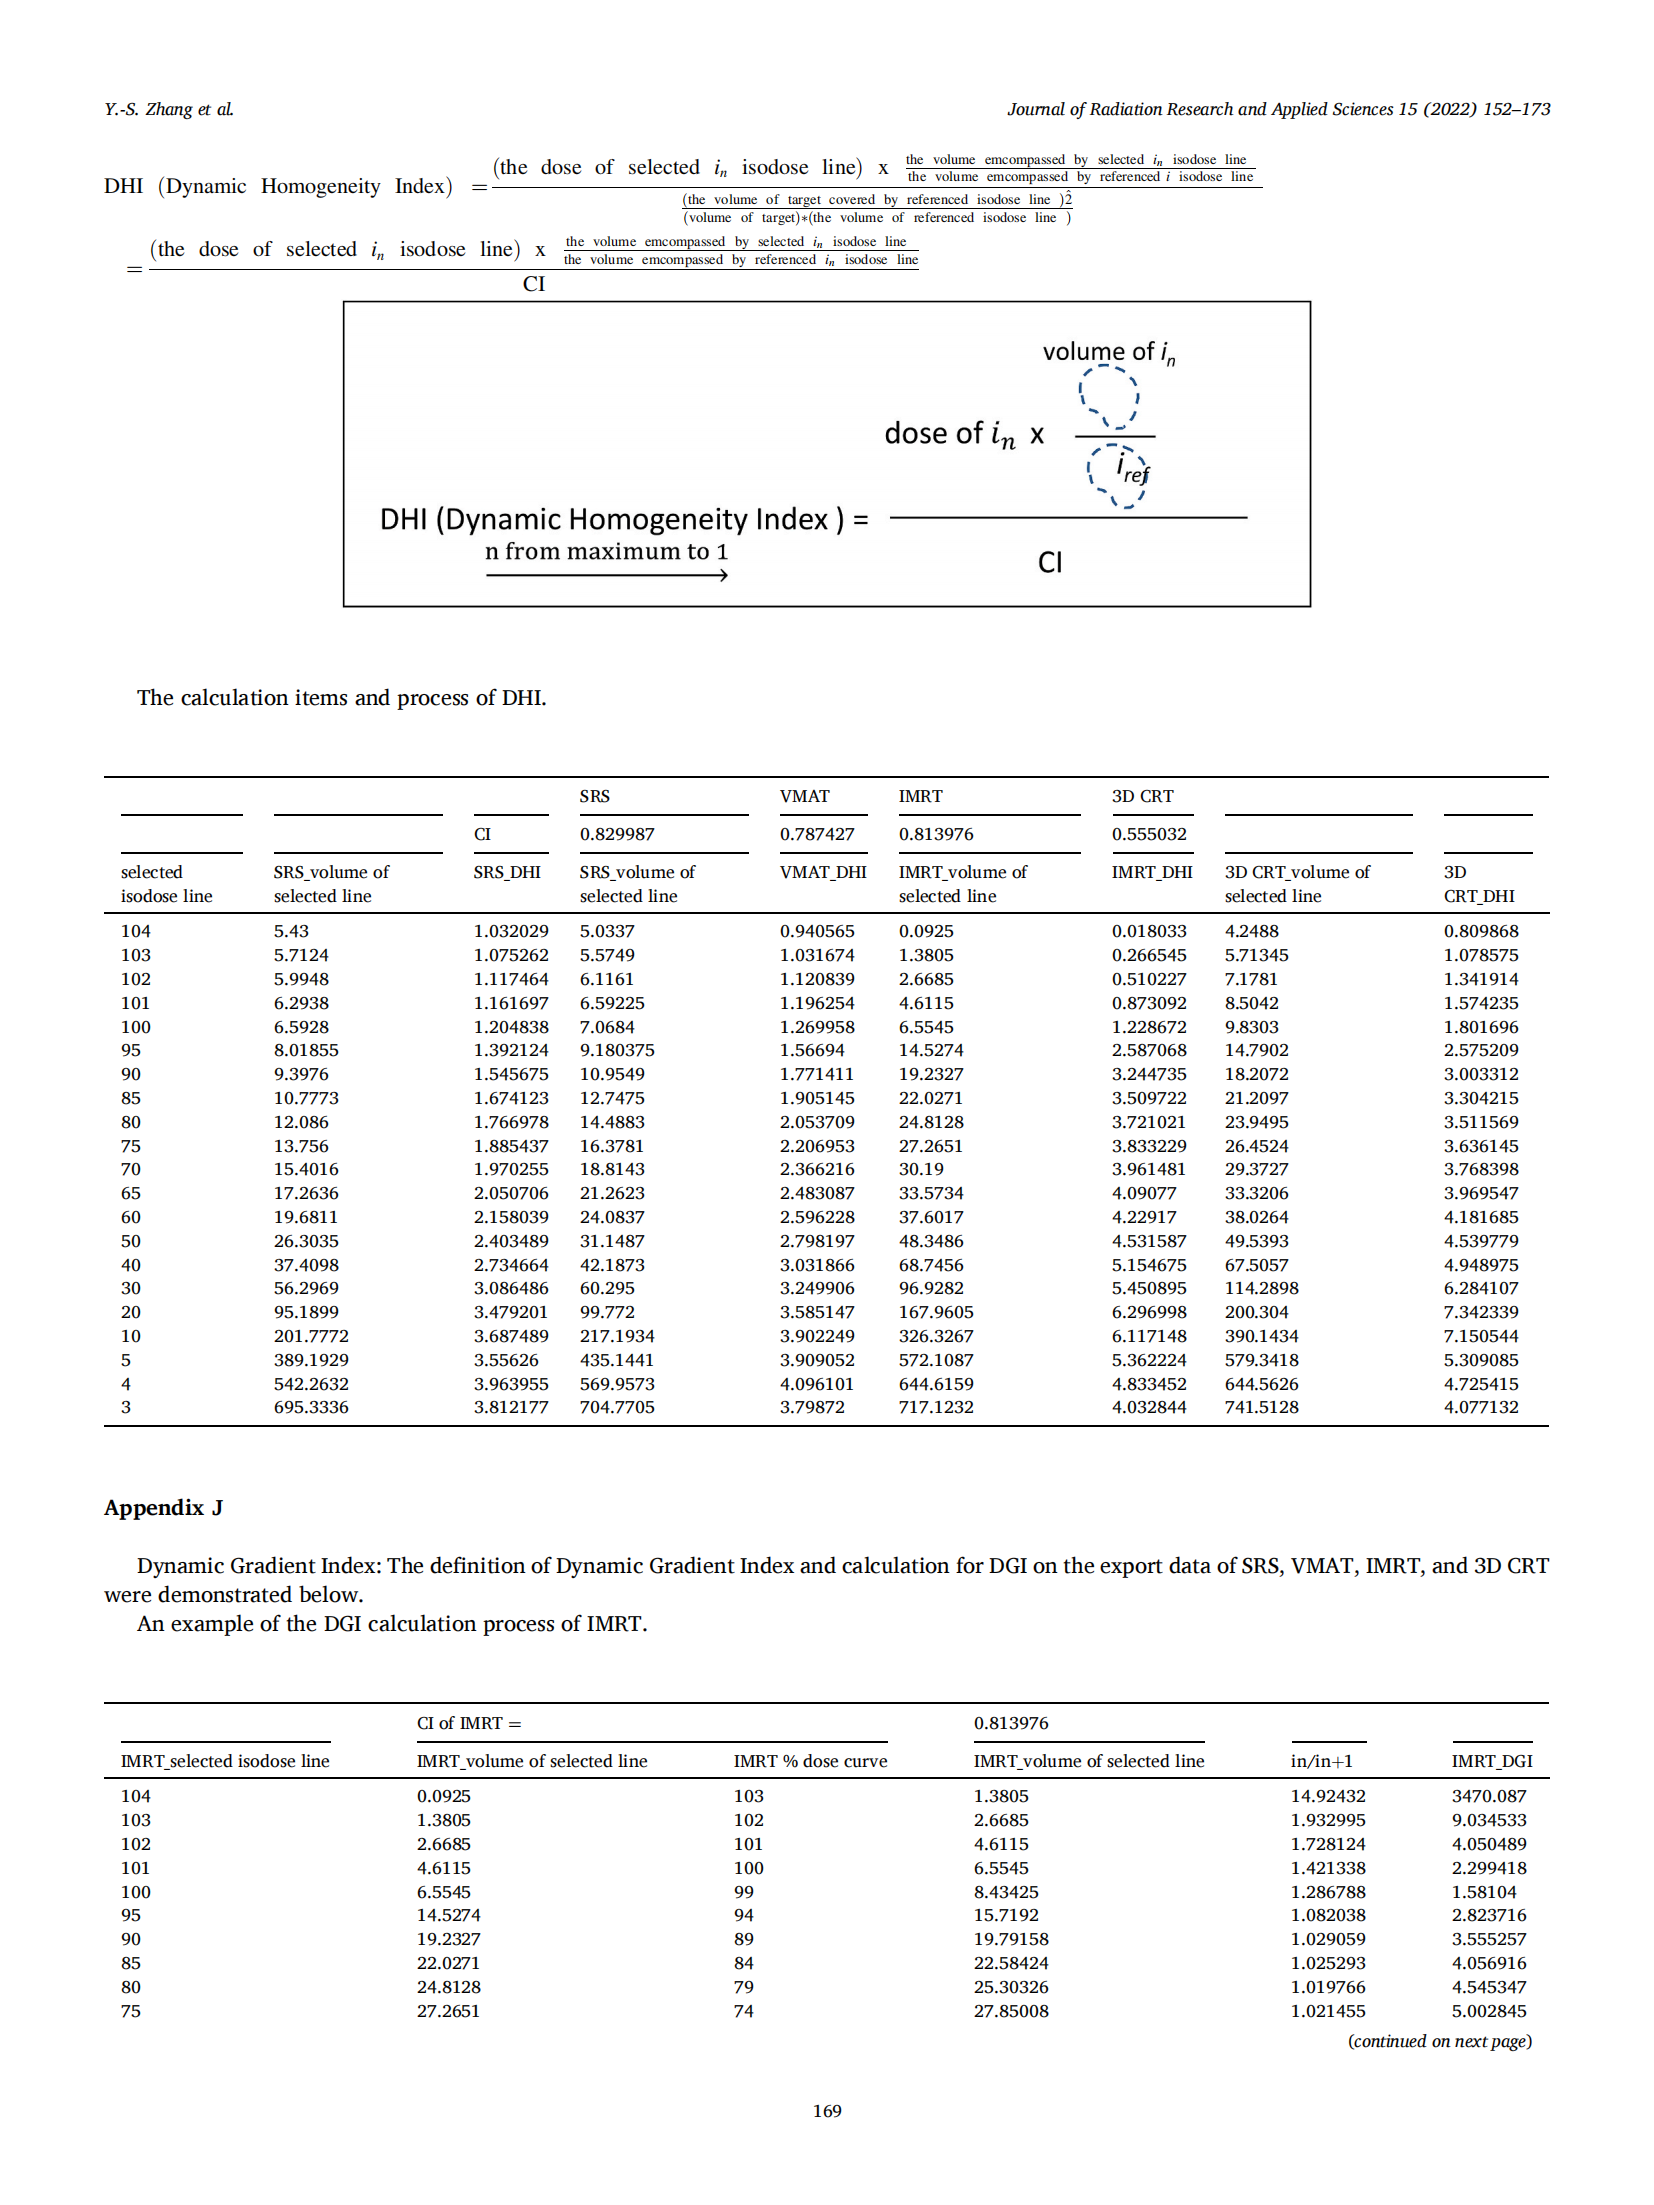
The author would like to emphasize again, the plan superiority is determined by how close the indices are to the line of the benchmark in this study. The four DHIs of different treatment techniques were shown in Fig. 3, and the area between 95% and 60% of p area is superior for 3D CRT than IMRT in homogeneity, while in the area between 35% and 5% of q area is superior for IMRT than3D CRT in homogeneity. The curve of IMRT and 3D CRT climb up and down reveal some interesting clinical concerns that DVH and other single-point evaluation indexes could not tell.
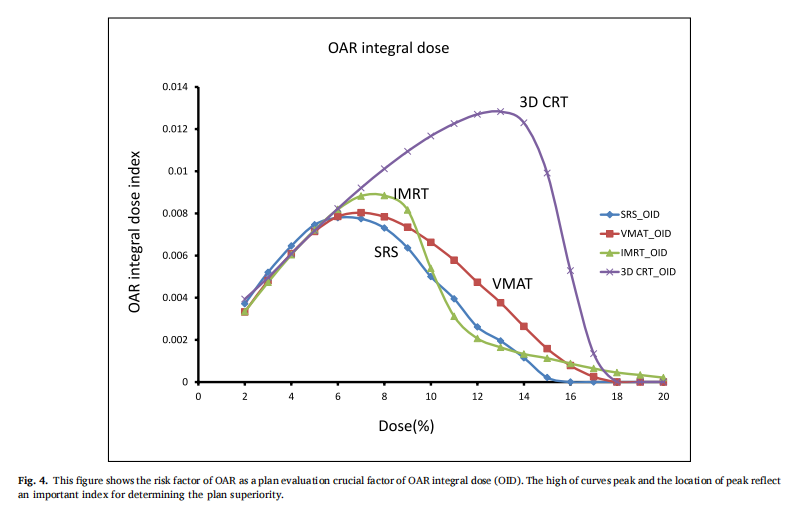
The risk factor of OAR as a plan evaluation crucial factor of OID was shown in Fig. 4. The high of curves peak and the location of peak reflect an important index for determining the plan superiority. The planner is always to expect to have an OAR curve located in the low dose area and wish the height as low as possible.
When taking into consideration of target integral dose and the normal tissue integral dose as well as OAR integral dose together using TSGR mathematic equation, the values were 103⋅7, 87⋅8, 78⋅7, and 63⋅2 for SRS, VMAT, IMRT, and 3D CRT, respectively. The design of TSGR in this study is to analyze the therapeutic gain ratio of the target, therefore, the larger of TSGR, the better plan it is. TSGR is the final judgment for pros and cons tangled cases especially in high precision and hypofractionated patients.
To let users view the whole tools of this study, TSGR and OID were scaled down and scaled up to 100 1 and 200 1 , respectively in Fig. 5. Readers can view from Fig. 5 to realize the whole pictures of the innovative plan evaluation tool indices.
DCI eliminates the shortcoming controversy of CI by using merely a single point for plan judgment, furthermore, either use the DCI curves in Fig. 1 or the average DCI in Table 1, the curves or values which come close to the line of benchmark of 1 are superior in CI.
DHI accentuates the advantage in distinguishing the superiority for homogeneity of HI defined by ICRU from the powerful DHI performance defined in this study either on the figures in Fig. 3 or the values in Table 1.
Many researchers tried to use intermediate dose spillage, high dosespillage, and gradient radius to judge the dose gradient outside the target, however, the DGI overrides the dispute and is replaced to be the dose gradient evaluation index. Readers are aware to the curves in Fig. 2a and b or the values of DGI in Table 1 that close to the benchmark of 1 indicates the dose gradient is superior (dose falloff rapidly) without any controversy. Both planners and radiation oncologists hope the less dose of organ at risk and the integral dose of normal tissue while hoping more dose of the target, therefore, the TSGR becomes a comprehensive evaluation tool for pros and cons tangled cases.
6. Conclusions
The readers are encouraged to test the powerful plan evaluation indices proposed in this study in person by simply exporting the approved plan patient’s data including the area covered by each selected isodose line, the target volume covered by the selected isodose line, OAR covered by the selected isodose line, the volume of target and OAR. All indices proposed in this study could be generalized by a personal computer like Excel without using MATLAB, C-language, and Visual Basic, etc. The vendors are also encouraged to build in all of these plan evaluation tools on treatment planning systems, hence the application could be very popular and revolutionize the radiation sociality in theevaluation of high precision treatment planning.
Conflicts of interest notification
There are no actual or potential Conflicts of Interest in this study. This manuscript has not been published nor concurrently submitted for publication elsewhere.
Acknowledgement
The author appreciates Physicist Meng Li for his great contribution to this study and is juxtaposed with first author (co-first authors with equal contribution). Professor Yan-Cheng Ye is juxtaposed with correspondence author (co-corresponding authors with equal contribution).
This work was supported by the Funding: Key R&D plan of the Science and Technology Program of Gansu Province, China. (19YF3FH001).
This work was supported by the Funding: Key R&D plan of Science and Technology Program of Gansu Province, China. (18YF1FH153).
This work was supported by the Gansu Sheng Ke Ji Ting, Central guided local science technology of Gansu Province, China. (The precise therapy platform of clinical and research for radiation oncology in carbon ion therapy)
Appendix
The clinical use of this plan evaluation tool was tested and demonstrated by a case of meningioma. The prescribed dose was 2700 cGy in 3 fractions of SRS. Both SRS and VMAT, IMRT, 3D CRT were normalized to 100% prescribed to 100% target volume (GTV with safe margin) for comparison. Dmax of brain stem <18 Gy. Dmax of optic chiasm <15 Gy. Dmax of optic nerve <15 Gy. Dmax of eye ball <15 Gy. Dmax of lens <3 Gy. The volume of target and brain stem (OAR) are 5⋅6 cm3 and 25⋅7 cm3 , respectively. Trearment Planning system of Eclipse 15.5 was adopted for the test and demonstration in this study.
The CT of this case was shown only three slices for reference below.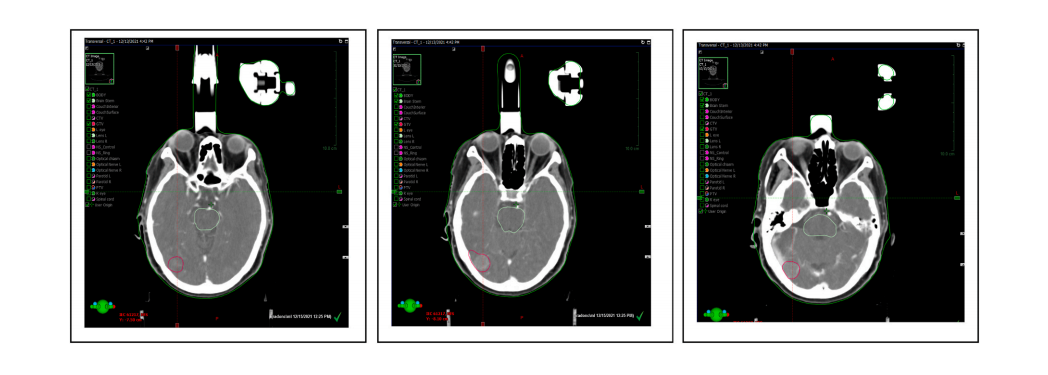
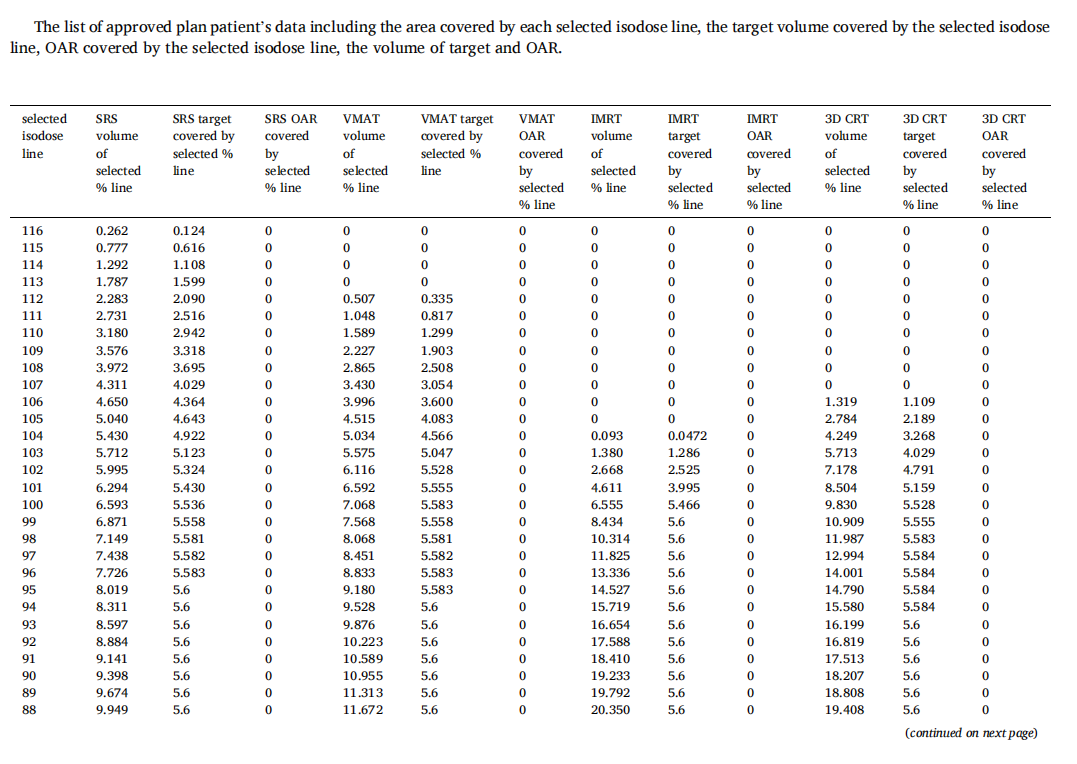
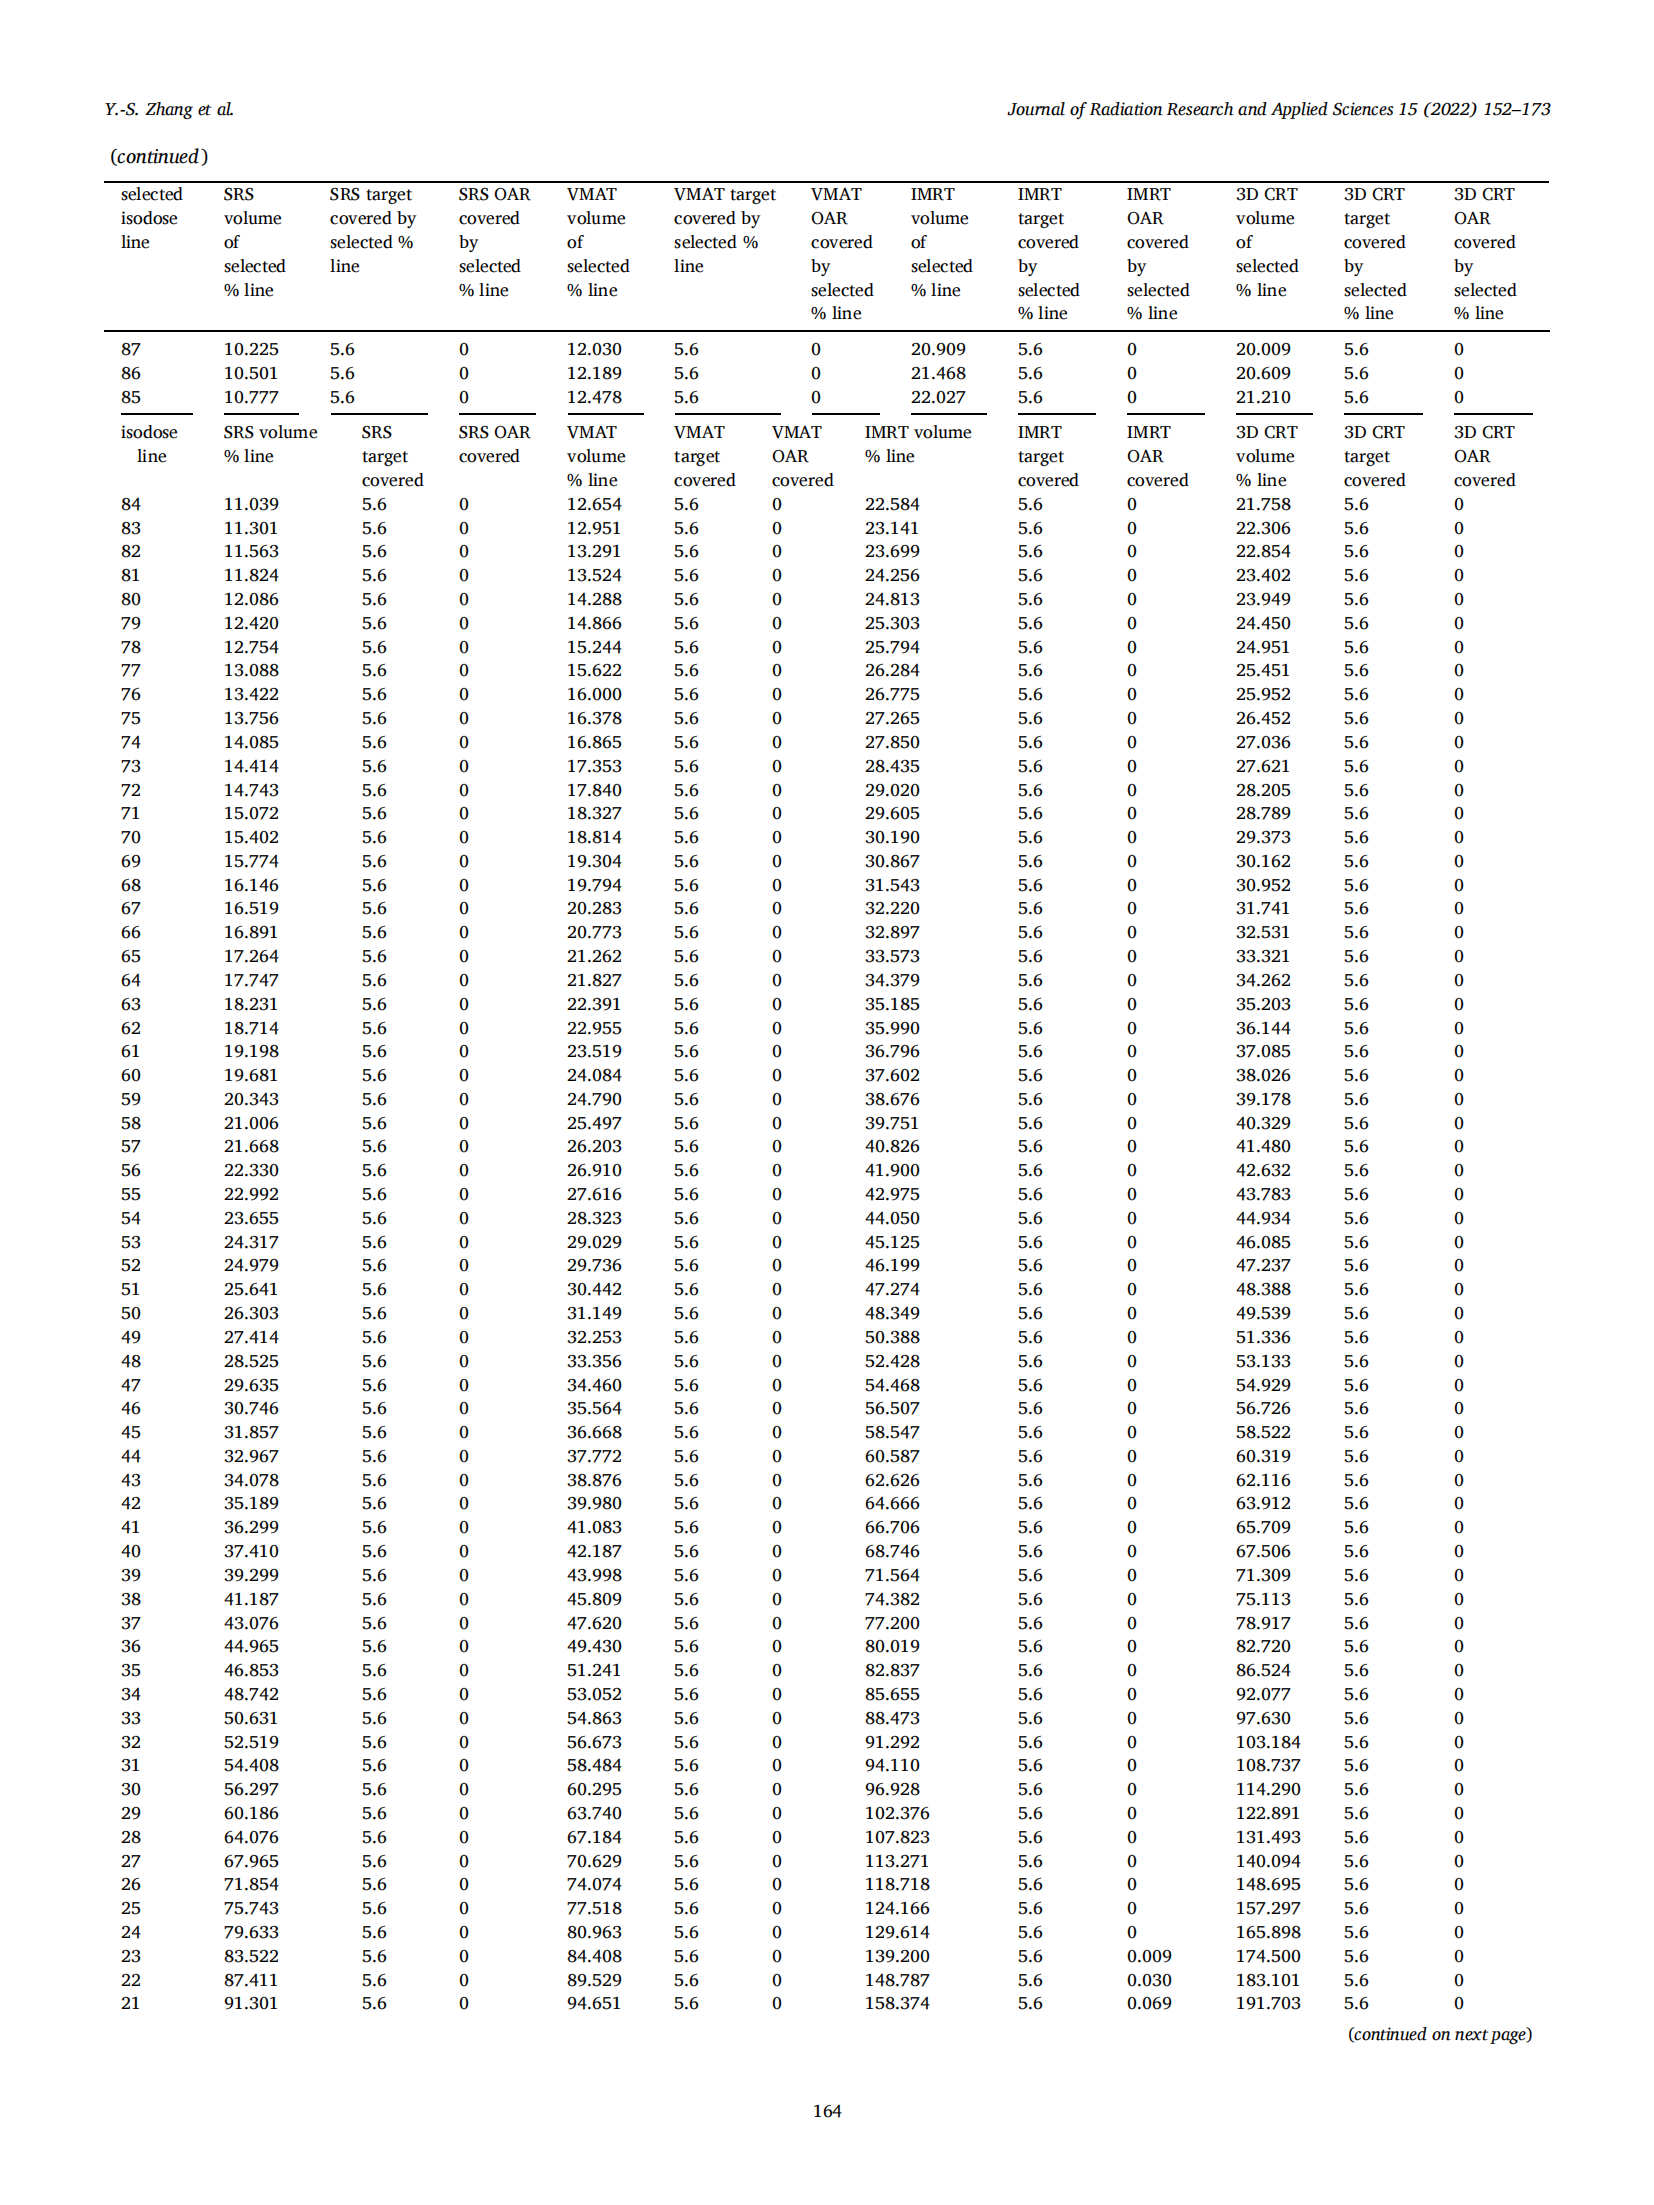
The readers are encouraged to test the powerful plan evaluation indices proposed in this study in person by simply exporting the approved plan patient’s data including the area covered by each selected isodose line, the target volume covered by the selected isodose line, OAR covered by the selected isodose line, the volume of target and OAR. All indices proposed in this study could be generalized by a personal computer like Excel (can use the author’s provided Excel teaching file) without using MATLAB, C-language, and Visual basic etc. The vendors are also encouraged to build-in all of these plan evaluation tools on treatment planning systems, hence the application could be very popular and revolutionize the radiation sociality in evaluation of high precision treatment planning.